
Do AI engines send people to search for brands?
- Not overall: since AI took off, branded search hasn’t grown faster than non-branded search.
- Maybe for the top three: brands that AI engines rank in the top three have grown faster since ChatGPT launched, but it isn’t yet known which came first.
In AI SEO, and in marketing at large, this is the million dollar question: how do AI engines actually impact the buyer journey? A common view is that once someone asks an AI engine a question and sees its list of recommendations, they go to Google and search for those brands by name. If that's true, wouldn't branded search grow faster than non-branded search as more of the world uses AI to search? Maybe, maybe not.
And since AI engines provide a list, there's an inherent follow-up question. People pay attention to order. In web search, we click the top results far more than the ones below, and we trust that order so much that when researchers secretly swapped the top two results, people still clicked the one in first place. If we treat AI answers the same way, the brands ranked highest in those lists should see their branded search grow fastest. Shouldn't they?
I looked at both questions in two Ranking Atlas studies of US brands, comparing their Google search volumes with where AI engines placed them. I found:
- No clear sign that branded search has grown faster than non-branded search since AI use became widespread.
- The brands that AI engines placed in the top three have grown 8.2 percentage points a year faster in branded search since ChatGPT launched than other brands in the same categories with similar starting volume (this second result is an association: I measured position after the growth, so I can't yet say which came first.)
This article sets out what I found, what the results can and cannot show, and why a brand's place in that list is now worth measuring every month.
Hundreds of millions of people now ask AI engines
ChatGPT was released to the public on 30 November 2022. Two months later, an analyst estimate put it at about 100 million monthly users. By the end of July 2025, OpenAI's own data showed more than 700 million people using it every week, nearly 10% of the world's adults.
In the US, Pew found that 34% of adults had used ChatGPT by early 2025, about double the share in 2023. Google, meanwhile, put AI answers inside its own results: AI Overviews from May 2024 and AI Mode from May 2025.
So, given the rapid adoption of AI engines in search, and given the assumption that they encourage people to search for brands, we should see a relative increase in branded search. No?
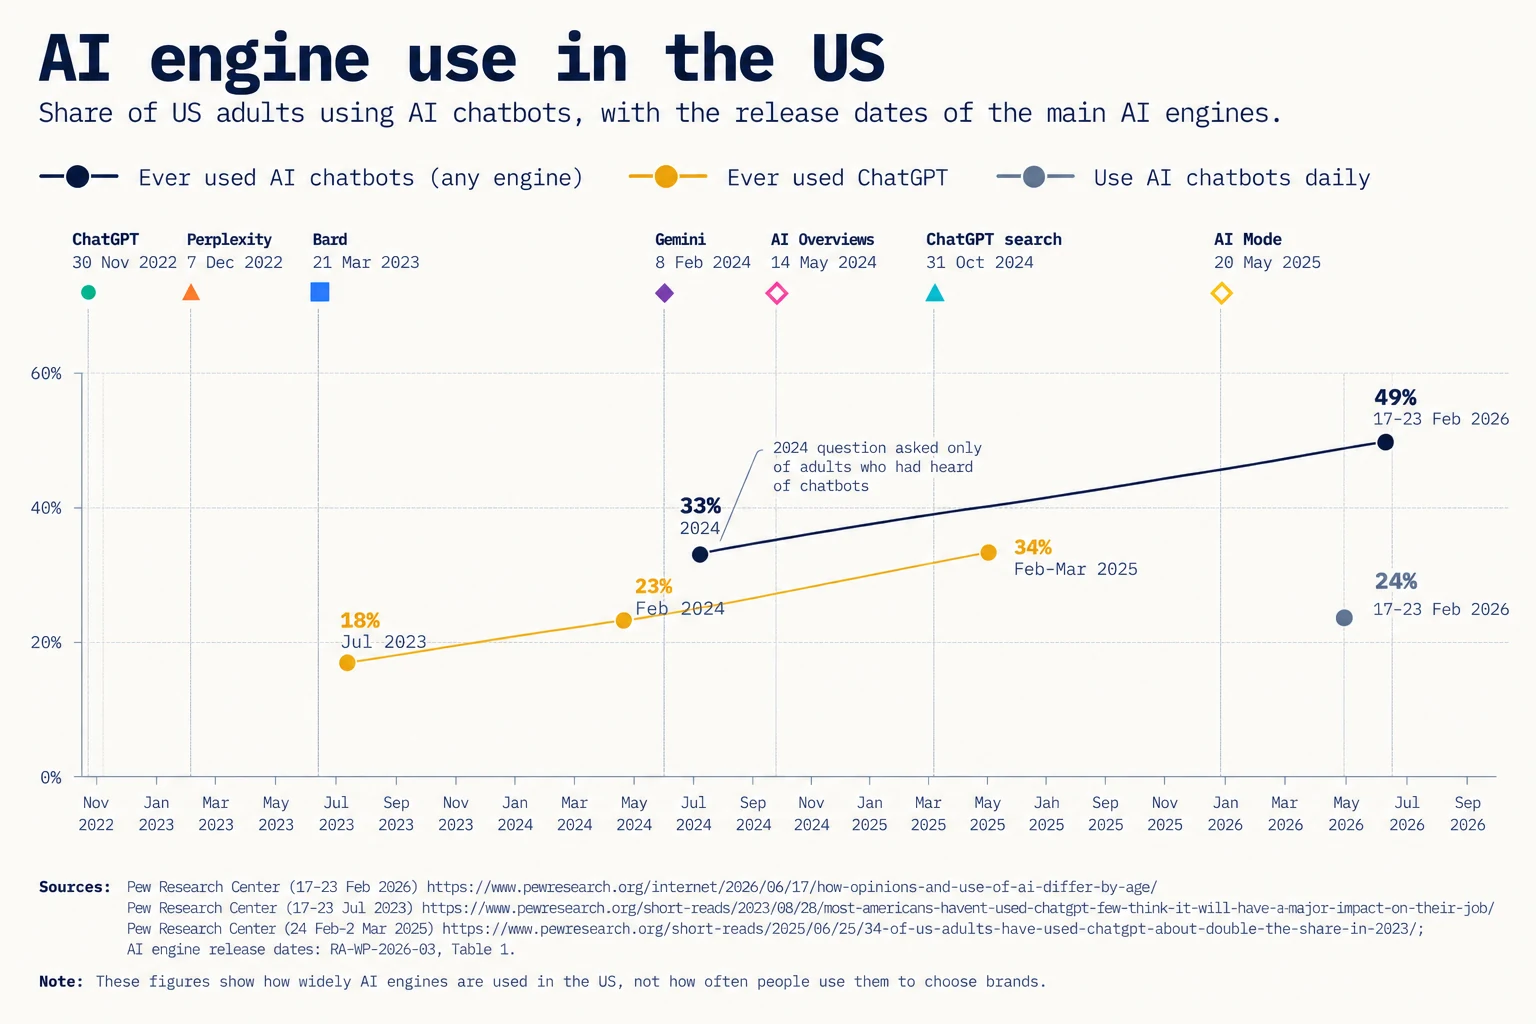
Source: Pew Research Center surveys, July 2023, February to March 2025 and February 2026; engine release dates from RA-WP-2026-03, Table 1. The 2024 point was asked only of adults who had heard of chatbots.
Did branded search grow faster once AI took off?
My first paper tested the broad claim. I measured how often ChatGPT and Gemini named each of 347 US brands across 14 categories, then compared that with their branded search in Google Trends and Google Ads, alongside 140 non-branded control terms. I give growth in percentage points (pp) a year: 2 pp is roughly 2% faster growth.
Branded search did not pull ahead. Total branded search in Google Ads rose 23.4% over the window, and the non-branded control terms rose 22.1%. Brands that AI engines named more often grew about 2 pp a year faster, a gap too small to confirm or rule out.
The AI side of this first study was light: 420 answers from two engines, ChatGPT and Gemini, collected on a single day. That's too few to say much about mentions or position, so I treat those results as a lead. The comparison of branded with non-branded search doesn't depend on it, because it uses only Google data.
A sharper pattern appeared in tests I added after seeing those results. Brands named among the first three in at least a fifth of their answers grew 7.1 pp a year faster than matched brands in the same category. With only 11 brands in first place, I couldn't tell whether first beat second or third.
That was the lead I followed.
Did the brands ranked highest grow fastest?
In my second paper, I measured position with five engines, 280 brand-free prompts and 8,190 answers. The tests I had fixed in advance did not pass: first place was no better than second or third, and growth did not climb step by step with position. What stood out instead was a line between the top three and everyone else.
The 68 brands in the top three grew 8.2 pp a year faster than the other 350, allowing for category and starting volume (Fig. 2b). Google Trends, which had data for 371 of the brands (54 of them in the top three), told the same story, with a gap of 7.9 (Fig. 2a). In the years before ChatGPT, 2015 to 2022, the top-three brands showed no advantage, which suggests they weren't simply on a faster path already. Figure 2 shows the two groups over time, with each engine release marked.
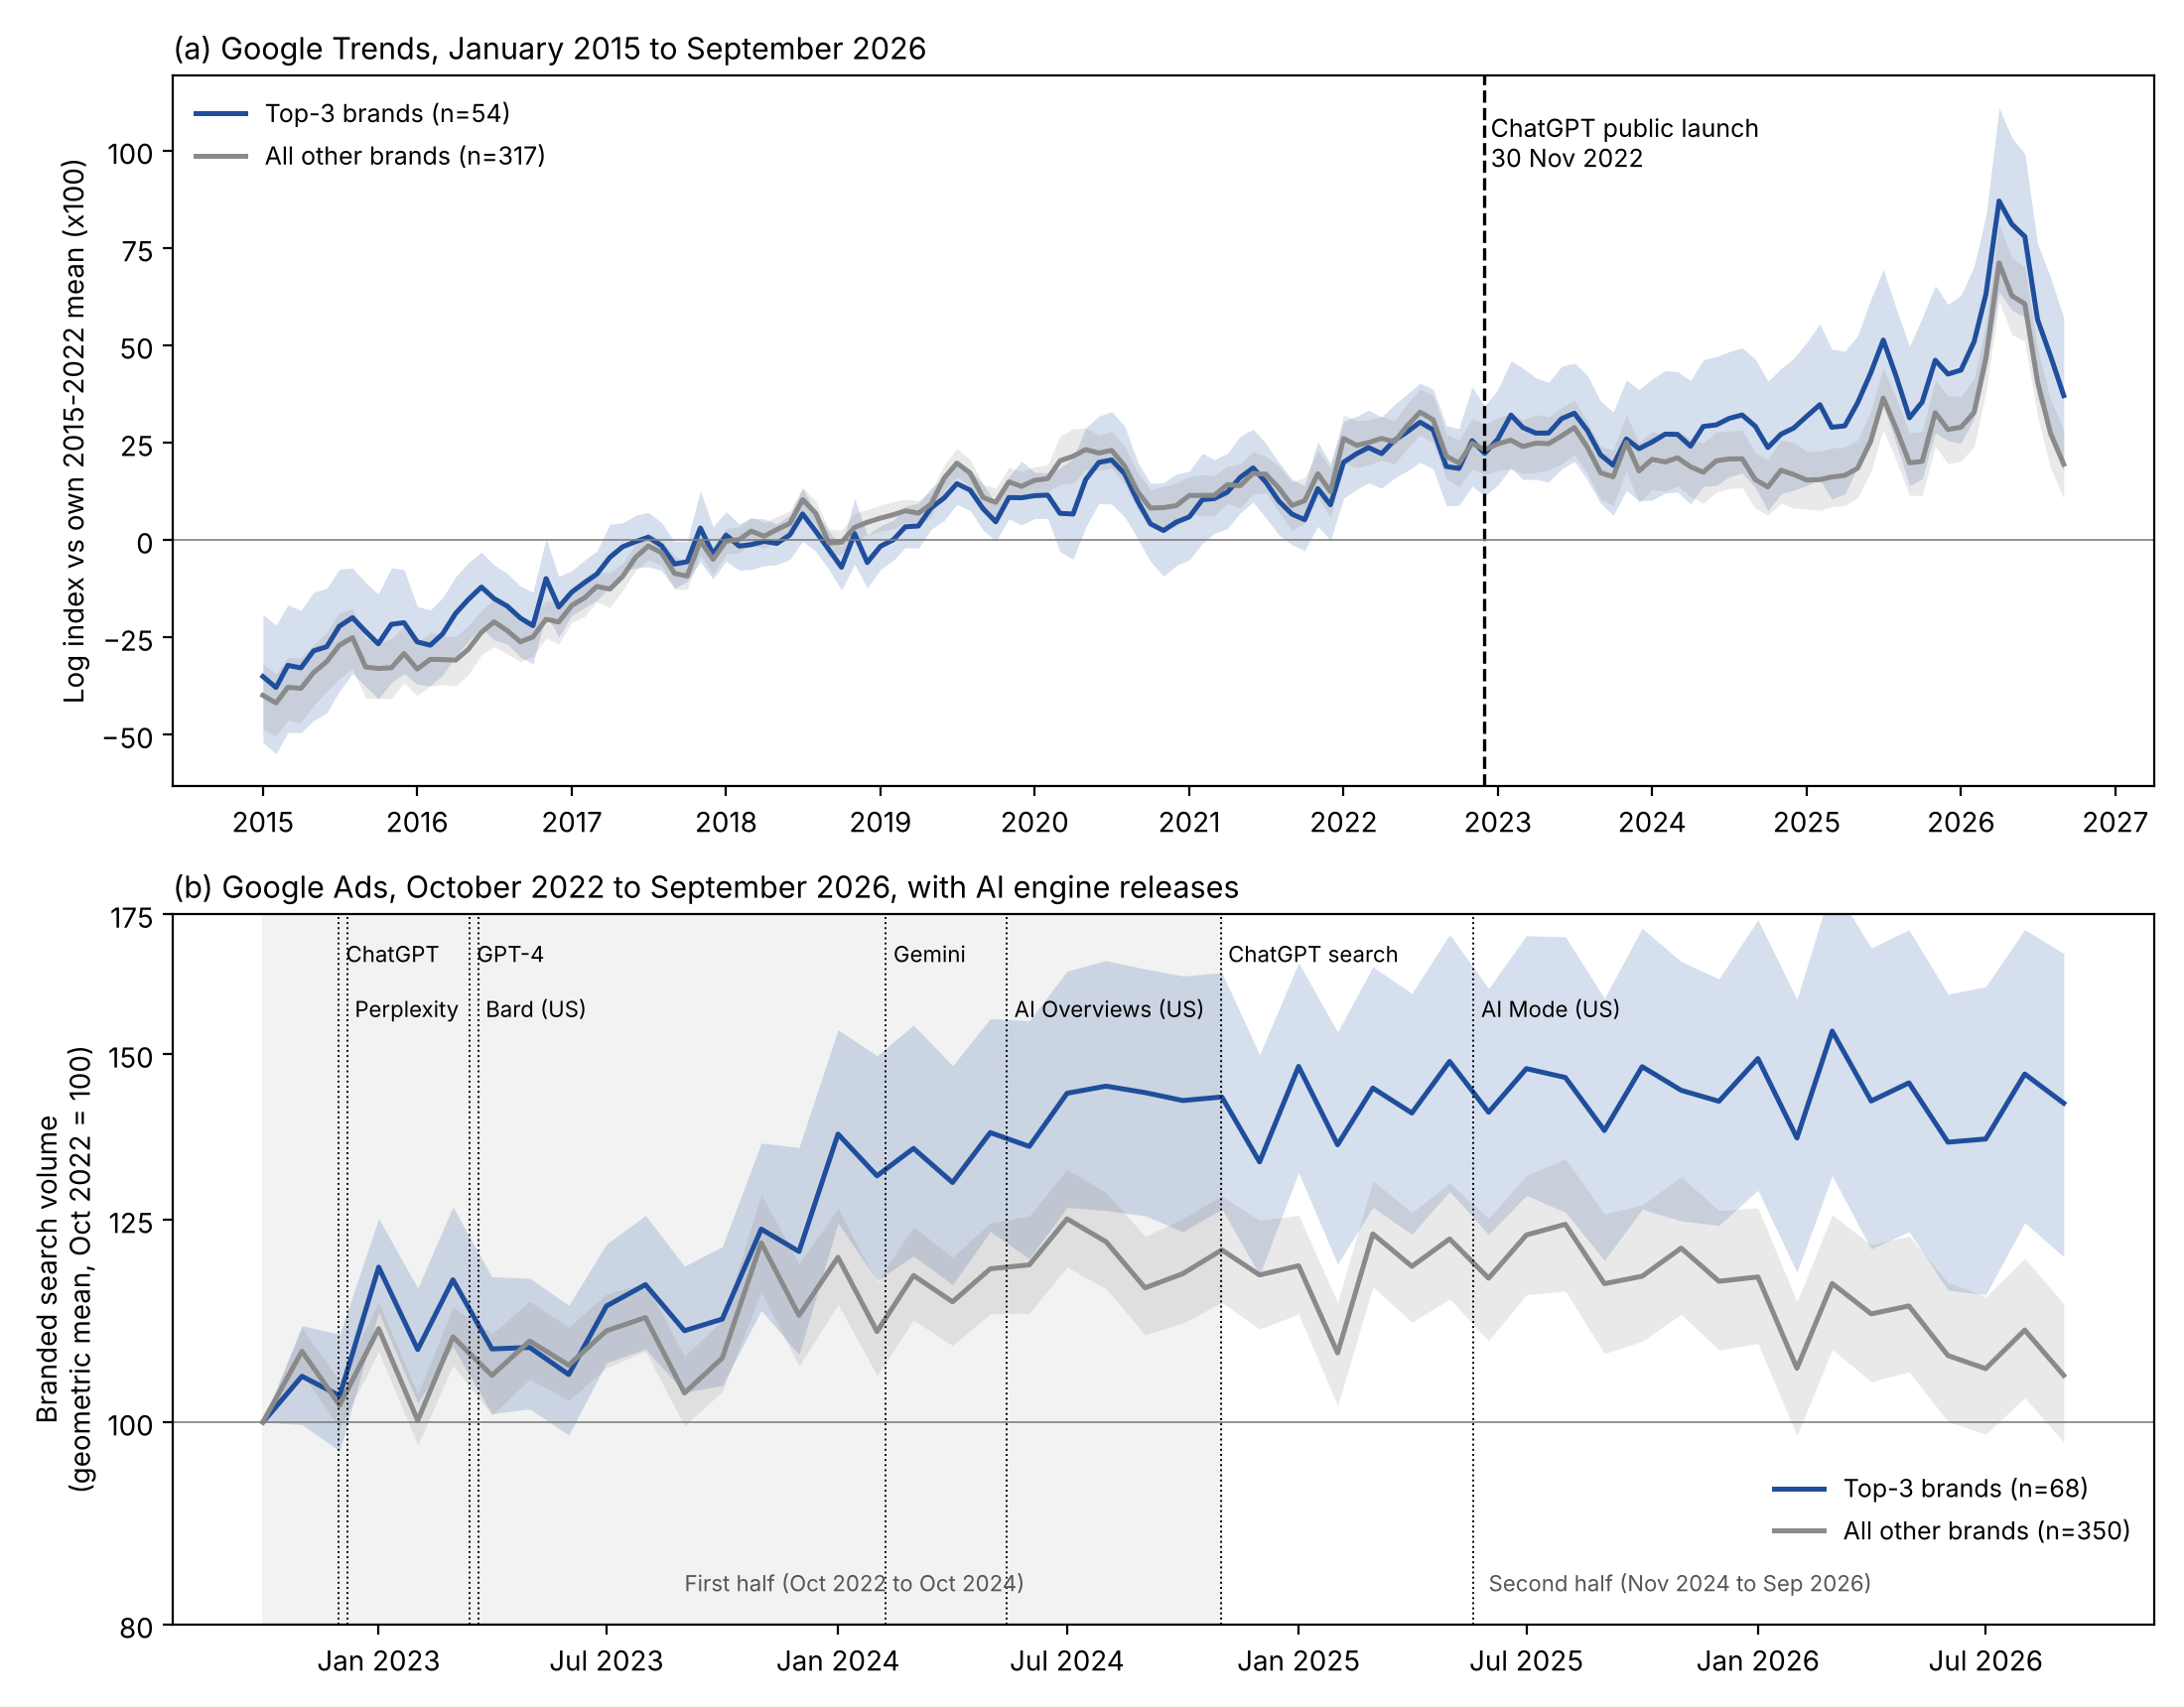
Source: RA-WP-2026-03, Figure 1. Unadjusted; positions measured in October 2026.
Position 1 and positions 2+3 grew at similar rates, yet both grew clearly faster than brands in position 4+ and brands not mentioned in results. Figure 3 below demonstrates the difference in branded search for positions 1, 2+3, and positions 4+.
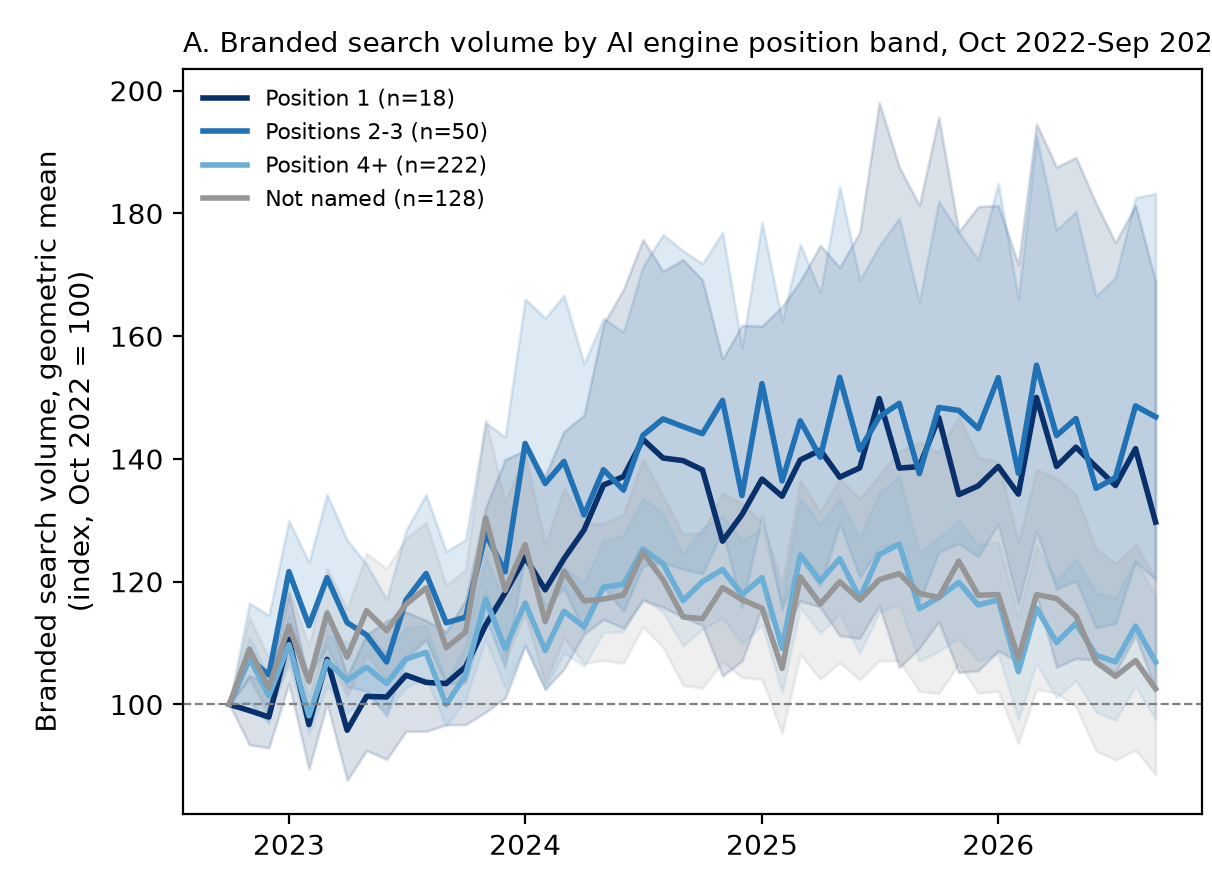
Source: RA-WP-2026-03, Figure 3A. Unadjusted; not a causal estimate.
What a top-three brand looks like: monday.com
monday.com, the project management tool, sits at positions 2 to 3 in my second study. All five engines named it, at a mean position of 2.5.
Its branded search in Google Ads grew 41.8 pp a year over the window, against a median of -2.9 for the other project management brands. By September 2026, with October 2022 set to 100, its volume index stood at 407.7 against 82.1 for the category median. Figure 4 shows the two lines.
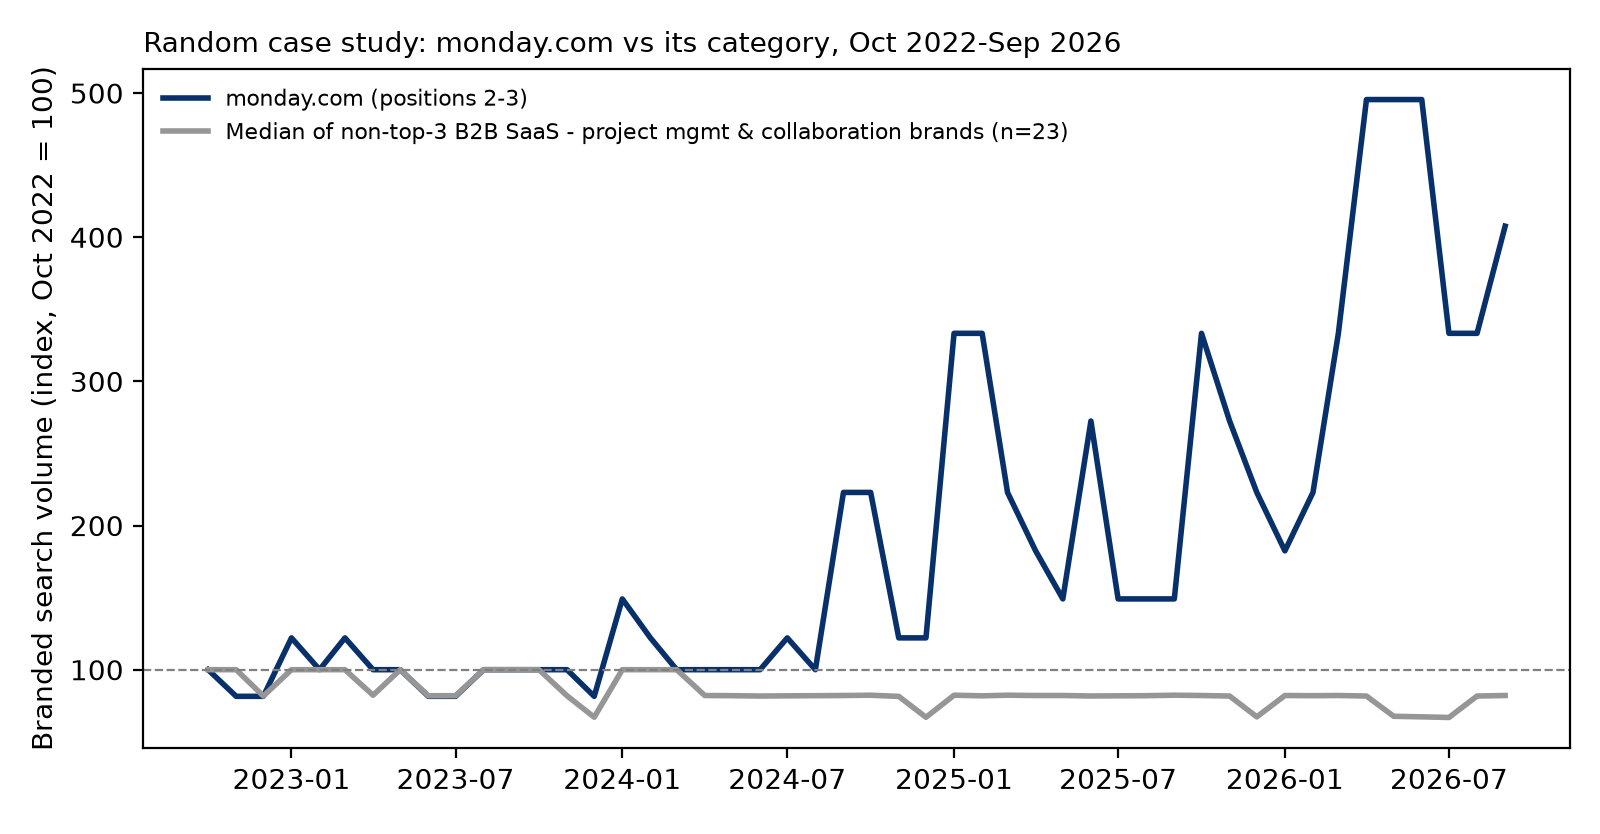
Source: RA-WP-2026-03, Figure 5. Google Ads US monthly search volume, indexed to October 2022 = 100, against the monthly median index of 23 project management and collaboration brands outside the top three. Positions measured in October 2026.
One brand proves nothing on its own, and the random draws say as much. Of 12 top-three brands drawn at random, 10 grew faster than their category's median, and two, Zinus and The Laundress, declined.
monday.com is the pattern at its clearest, not the pattern itself.
What the two studies can't show
Both studies are observational: nothing was randomised, so they show that today's top-three brands are the ones that grew, not which came first.
I measured positions once, in October 2026, after the growth. AI answers from 2023 or 2024 can't be rebuilt, so I can't see which came first for any brand. AI engines draw on what's written about brands online, and brands that have grown get written about more. A brand may be recommended because it grew, rather than grow because it was recommended.
I chose the top-three comparison after seeing the data, and the two studies share most of their brands and the same search data, so their agreement shows the result doesn't depend on how I measured position, not that it has been replicated. Part of the gap is also between brands the engines name at all and brands they don't.
So: an association, measured after the fact.
Measuring position first
The way to settle the order of events is to measure position before the outcome. On 25 October 2026, before collecting any data, I registered a 12-month study with the Open Science Framework: 416 US brands, positions measured monthly from 26 October 2026, branded search tracked from November 2026. Hypotheses, sample, analysis and decision rules are fixed in the registration. I'll publish the result whichever way it falls.
How other researchers could test this better
I encourage any other AI SEOs to conduct a more thorough investigation into this hypothesis, by doing this:
- Measure position before growth, and keep measuring. Ask several AI engines the same brand-free questions every month, several times each, and record where each brand is placed. Then see whether changes in position come before changes in branded search.
- Use different brands, and fix the plan first. Choose brands, categories or countries that my studies didn't cover, so the result is a true replication. Write down your questions, brands and tests, and register them publicly before you look at any search data.
- Follow brands whose position changes. When a model update moves a brand into or out of the top three, compare its branded search over the following months with similar brands whose position stayed the same. That's the closest thing to an experiment that search data allows.
If you run one of these, I'd like to read it.
What else could explain it?
There's an obvious alternative. The brands in the top three of AI answers may also be the ones spending most on being seen: advertising, social media, sponsorships, billboards and endorsements. That spending can raise branded search directly. It can also get a brand written about more, and what's written about a brand online is part of what AI engines draw on. If so, marketing would be behind both the top-three position and the search growth, and the AI ranking would add little of its own.
I didn't measure marketing spend, so I can't rule this out. Two things push against it, though neither settles it. The gap held after allowing for category and starting volume. And the top-three brands weren't growing faster before ChatGPT launched, which a brand that had long outspent its rivals would likely show. A campaign that started after 2022 would still fit the pattern.
Nonetheless, this research suggests there could be a link between where AI engines rank a brand and how many people go on to search for it. The 12-month study will show whether position comes before growth. Separating the ranking from the marketing behind it will need spend data as well.
So should you chase the top three?
If you run a brand, the brands in the top three of AI answers are the ones whose branded search has grown. Whether getting into the top three causes that growth is what the 12-month study is built to test, so in the meantime, measure where you rank.
For search as a whole, the picture is mixed. Hundreds of millions of people use AI engines, yet US branded search hadn't pulled ahead of non-branded search by September 2026. The gap was larger in categories where people are more likely to ask an AI engine for advice, 10.9 pp against 4.1, as the branding account predicts, though the difference is too uncertain to lean on.
What has shown up so far is narrower than the million dollar question: a small set of brands at the top of AI answers, growing faster, for reasons the next study is built to separate.
References
- Chatterji, A., Cunningham, T., Deming, D. J., Hitzig, Z., Ong, C., Shan, C. Y., & Wadman, K. (2025). How people use ChatGPT. NBER Working Paper 34255. https://doi.org/10.3386/w34255
- Gottfried, J., Bishop, W., Anderson, M., Faverio, M., Park, E., & McClain, C. (2026). How Americans' opinions and use of AI differ by age. Pew Research Center, 17 June 2026. https://www.pewresearch.org/internet/2026/06/17/how-opinions-and-use-of-ai-differ-by-age/
- Grainger, D. P. (2026). Is AI engine exposure associated with rising branded search? A two-source study of 347 US brands, 2015-2026, with a pre-specified analysis plan. Ranking Atlas Working Paper RA-WP-2026-02. Zenodo. https://doi.org/10.5281/zenodo.23636267
- Grainger, D. P. (2026). Brands ranked in the top three positions by AI engines in October 2026 had faster branded search growth from ChatGPT's launch in 2022 than brands outside the top three positions: exploratory evidence from 418 US brands. Ranking Atlas Working Paper RA-WP-2026-03. Zenodo. https://doi.org/10.5281/zenodo.23636562
- Grainger, D. P. (2026). Does top-3 recommendation position in AI engines come before branded search growth? A 12-month prospective study of 416 US brands: preregistration. OSF. https://doi.org/10.17605/OSF.IO/MFZ5T
- Hu, K. (2023). ChatGPT sets record for fastest-growing user base: analyst note. Reuters, 1 February 2023. https://www.reuters.com/technology/chatgpt-sets-record-fastest-growing-user-base-analyst-note-2023-02-01/
- Joachims, T., Granka, L., Pan, B., Hembrooke, H., & Gay, G. (2005). Accurately interpreting clickthrough data as implicit feedback. Proceedings of SIGIR 2005, 154-161. https://doi.org/10.1145/1076034.1076063
- OpenAI. (2022). Introducing ChatGPT. https://openai.com/index/chatgpt/
- Pew Research Center. (2023). Most Americans haven't used ChatGPT; few think it will have a major impact on their job. 28 August 2023. https://www.pewresearch.org/short-reads/2023/08/28/most-americans-havent-used-chatgpt-few-think-it-will-have-a-major-impact-on-their-job/
- Pew Research Center. (2025). 34% of U.S. adults have used ChatGPT, about double the share in 2023. https://www.pewresearch.org/short-reads/2025/06/25/34-of-us-adults-have-used-chatgpt-about-double-the-share-in-2023/
- Pichai, S. (2025). Google I/O 2025: From research to reality. Google. https://blog.google/innovation-and-ai/technology/ai/io-2025-keynote/
- Reid, E. (2024). Generative AI in Search: Let Google do the searching for you. Google. https://blog.google/products-and-platforms/products/search/generative-ai-google-search-may-2024/
- Reid, E. (2025). AI in Search: Going beyond information to intelligence. Google. https://blog.google/products-and-platforms/products/search/google-search-ai-mode-update/