
Is AI engine exposure associated with rising branded search? A two-source study of 347 US brands, 2015-2026, with a pre-specified analysis plan.

RA-WP-2026-02
Structured abstract
Background. Practitioners widely describe AI engines as a branding channel. In this account, users meet brands in AI answers and then search for them by name on Google. If this holds at scale, US branded search should rise relative to non-branded search as AI adoption grows, and brands that AI engines mention more should gain more.
Methods. We froze an analysis plan with three hypotheses (H1a-c) before collecting outcome data, and later added four amendments; two of them added tests of AI recommendation (H2) and recommendation position (H3) after earlier results had been seen. The sample was 347 US brands in 14 categories plus 140 non-branded control terms. AI exposure, top-3 rate and position tier came from 420 ChatGPT and Gemini responses to category prompts (Gemini answers were not US-localised). Outcomes were US branded search in Google Trends (2015-2026) and Google Ads (2022-2026), with pre-AI placebo tests, split-half checks, Holm correction and equivalence tests. Growth is reported in percentage points (pp) of annual growth (log points x 100).
Results. No H1 test was supported. The exposure gradient was +2.13 pp per year per SD in Trends (95% CI -0.82 to 5.08) and +2.28 in Ads (95% CI -1.15 to 5.72), and equivalence to zero was not established, so an effect of 2 pp cannot be ruled out. Branded search did not gain share against non-branded search in either source. Brands named among the first three in at least 20% of AI answers grew faster: +7.13 pp per year against matched brands in Ads (95% CI 2.10 to 12.36), with no significant gap in 2015-2022 Trends growth, but the gap was not stable over time. Ads growth was ordered by position tier (+5.42 pp per tier step), but before ChatGPT the ordering tended to run the other way. Under the pre-specified rules both results are inconclusive, and whether first position beats positions 2-3 could not be resolved (11 brands in first position).
Conclusions. We found no confirmatory evidence that AI adoption has raised US branded search overall. Brands that AI answers name early show faster recent branded growth, but the top-3 gap was unstable over time and the position ordering tended to reverse a pre-2022 pattern. These patterns are compatible with a modest aggregate echo of individual-level effects reported by industry studies, and also with AI engines favouring already-popular brands. The study does not establish causation.
Keywords: branded search; generative AI; answer engines; Google Trends; Google Ads; pre-specified analysis; search engine optimisation
1. Introduction
1.1 AI engines as a branding channel
A widely held view among search marketing practitioners is that generative AI search works as a brand-discovery channel. Users ask an AI engine for recommendations, see a short list of brands, and then search for those brands by name on Google. Tool vendors and agencies have described this mechanism and suggested branded search volume as a way to track the value of AI visibility (Goodwin, 2024; Seer Interactive, 2026; Silva, 2026). Panel studies offer user-level support. In one, users who received a ChatGPT brand recommendation were 2.5 times as likely to visit that brand’s site within seven days as a direct competitor’s, and about 56% of these visits arrived via search (Kehoe, 2026); in another, users recommended a brand they had shown no recent sign of using were 182% more likely to search for it within a week (Iannelli, 2026).
If AI recommendation drives branded search at scale, it should leave a footprint in public search data: branded queries should grow faster than non-branded queries after ChatGPT’s public launch on 30 November 2022, and brands that AI engines name more often should benefit more. The present study tests that prediction.
1.2 Prior evidence
The closest direct test is Indig (2026b). Across 632 lag tests on four brands, he compared weekly AI visibility with later branded search impressions and Direct traffic and could not establish a reliable link once the timing was tested against shifted series. Indig’s earlier work associates brand strength with AI visibility: in Semrush data on ChatGPT, the clear leader in a category’s mentions had higher branded search volume than the runner-up in 55.7% of pairs (Indig, 2026a). Both studies report associations, not causes.
To our knowledge, no study has tested aggregate branded versus non-branded search volume against AI adoption over a long window, with a pre-specified analysis plan, at the scale of hundreds of brands.
1.3 Hypotheses
- H1c (primary): brands with higher AI-engine mention exposure show a larger increase in branded search growth from December 2022, the first full month after ChatGPT’s public launch.
- H1a: from December 2022, aggregate branded search grows faster than matched non-branded search.
- H1b: AI adoption is positively associated with the branded share of search at lags of 0 to 3 months, more strongly than expected by chance, using a null distribution that searches the same four lags.
2. Methods
2.1 Pre-specified analysis plan and amendments
The analysis plan was frozen and hashed (SHA-256) in a private version-controlled repository (git) before the outcome data were pulled (Table 1). Amendments were committed and hashed in the same way. The plan was not deposited with a public registry, so its timing cannot be independently verified. The plan files and amendments are available from the author on request. Throughout, “pre-specified” means specified in these frozen files before the relevant test was run.
Table 1. Analysis plan record.
| Document | Content |
|---|---|
| Analysis plan (frozen) | Hypotheses, sample, models, decision rules; frozen before the study’s outcome data were pulled |
| Amendment 1 | Trends pull design (single keyword vs grouped); decision rule fixed before any study Trends pull |
| Amendment 2 | Split into analyses A, B and C, dropping the calibration of Trends to Ads; committed before any hypothesis test |
| Amendment 3 | H2: top-3 first-mention “recommendation” tests; added after the H1 results were seen |
| Amendment 4 | H3: recommendation position tiers; added after the H2 results were seen |
Disclosed deviations:
- Before the freeze, a 5-keyword Ads test and one Trends test were viewed to check price and response format. The three Trends repeat pulls were made within one day and seasonality was handled with calendar-month fixed effects instead of STL decomposition.
- The Trends-Ads disagreement found in data quality checks was seen before Amendment 2 was written.
- Brand-list membership could not be verified against the named source lists, so the sample is described as purposive.
- The analysis in Section 3.5 was not pre-specified and is labelled exploratory.
- Amendment 3 (H2) was prompted by a published industry study (Iannelli, 2026). Only the H2 treatment distribution, not its association with any outcome, was inspected to set the threshold.
- Before Amendment 4 (H3), only tier cell sizes (treatment only) were inspected.
2.2 Sample
The sample comprises 350 US brands across 14 categories, 25 per category; 3 pre-specified exclusions leave 347 primary brands. It also includes 140 non-branded controls, 10 per category: 5 head terms and 5 “best X” terms. Brands were chosen to span megabrands, mid-market brands and challengers. A pre-specified event screen excluded Sonder (ceased operating in 2025), Going (rebranded in 2022) and Kaspersky (banned in the US in 2024). A further 94 brands with ambiguous names or notable events were flagged and kept; excluding them is reported as a sensitivity check.
2.3 Measures
AI exposure E_i is the share of 30 responses that named brand i. These were 5 category prompts x 3 runs x 2 engines: ChatGPT (gpt-5.5-2026-04-23 with web search, country set to US) and Gemini (requested as gemini-3.5-flash, resolved by the API to gemini-3.6-flash, with web search). The Gemini endpoint rejected the country parameter, so Gemini answers were not US-localised, while ChatGPT answers were. The prompts did not name any brand, and all runs took place on 23 October 2026. E_i was standardised to SD = 1. AI adoption A_t is the mean of the Google Trends US indices for “chatgpt”, “gemini” and “perplexity”.
Outcome A is the Google Trends US monthly index, one keyword per request, January 2015 to September 2026. Three pulls were taken and the median used, with y = ln(index + 1). Outcome B is Google Ads US monthly search volume (via DataForSEO), October 2022 to September 2026, with y = ln(volume); these were the only 48 months available. The window begins two months before ChatGPT’s public launch.
Units. Growth rates and slopes are estimated on log outcomes, so a coefficient is in log points per year. We report it multiplied by 100 and call it “pp of annual growth” (percentage points of annual growth), so +2 pp means +0.02 log points per year, approximately 2% per year. Current-volume effects (H2c, H3c) are reported as log points x 100 of volume.
2.4 Analyses
Analysis A uses Trends (Outcome A), Analysis B uses Ads (Outcome B), and Analysis C compares them.
H1c. Stage 1 estimated, per brand, either a segmented-trend slope change at December 2022 over January 2015 to September 2026 (Trends) or the October 2022 to September 2026 growth rate (Ads), with calendar-month fixed effects. Stage 2 regressed the stage-1 estimate on E_i with category fixed effects. The one-sided p-value came from a category-clustered wild bootstrap (14 clusters, Webb weights, 9,999 replications), and equivalence was tested with TOST against +/-2 pp. The pre-AI placebo (Trends only) used the same model with a placebo break at January 2019, fitted on 2015-2022 data; it passes if the two-sided wild-bootstrap p exceeds 0.10. The split-half check refitted the model with post halves of December 2022 to October 2024 and November 2024 to September 2026, and requires the same sign in both halves with one-sided p < 0.10 in each.
H1a. A segmented regression of D_t = B_t - N_t, the brand-demeaned log index for branded terms minus non-branded terms, with Newey-West standard errors. The model included level and slope terms for AI Overviews (May 2024) and AI Mode (May 2025). In Ads no break can be identified, so H1a-B is descriptive only.
H1b. The test statistic was the maximum correlation, over lags 0 to 3, between differenced and deseasonalised A_t and S_t = D_t, from December 2022 to September 2026. Two nulls were used, 2,000 circular shifts (minimum shift 12 months) and 2,000 block bootstraps (block length 12), and the larger p-value is reported. H1b is supported only if the split-half check also passes.
Multiple testing and decision rules. Holm correction was applied within each source. An effect counts as “supported” only if it is significant after Holm correction, its pre-AI placebo passes and its split-half check holds. Because Ads has no pre-period, the Ads H1 tests could at most be inconclusive.
Analysis C. Analysis C compared the two sources over their overlap window, October 2022 to September 2026, for the 345 brands with Ads data. It compared per-brand growth (Spearman correlation and sign agreement), aggregate linear slopes of B_t, N_t and D_t, and the exposure gradient from each source. The pre-set rule was that the sources “agree” if Spearman >= .70 and sign agreement >= 80%. Because Analysis C uses its own window, brand set and stage-1 outcome, its Trends estimates differ from those of Analysis A (see Section 3.4).
Software. Python with statsmodels; random seed 20261023.
2.5 Added test: AI “recommendation” (H2, Amendment 3)
Treatment. For each of the 420 AI responses (Section 2.3), we recorded the order in which the sample brands of that category were first mentioned, using the frozen brand-name matching (alias) rules. A brand’s top-3 rate is the share of its 30 category responses in which it was among the first three sample brands named. Brands were classed as “recommended” if their top-3 rate was at least 0.20. This gave 83 of 345 brands in Ads and 81 of 327 in Trends. Thresholds of 0.10 and 1/3 were run as exploratory sensitivity checks. A 20-response spot check confirmed that the parsing followed the first-mention order. It also identified three limitations: ranks count sample brands only, first mentions include brands named in introductory text, and combined items such as “Clorox / Lysol” count as two brands.
Hypotheses.
- H2a: the top-3 rate (per SD) is associated with branded growth. This was tested separately for Ads 2022-2026 growth and for the Trends slope change at December 2022, with category fixed effects and a category-clustered wild bootstrap.
- H2b: recommended brands grow faster than non-recommended brands. Each recommended brand was matched 1:1 to a brand in the same category with a similar Ads volume in 2022-2023, and inference used a category-cluster bootstrap.
- H2c: the top-3 rate is associated with current (October 2025 to September 2026) Ads volume. This test is cross-sectional and open to reverse causation.
Checks and decision rules. The pre-AI placebo re-ran the H2a and H2b models on Trends growth for January 2015 to November 2022, and passes if the two-sided p exceeds 0.10; because Ads has no pre-period, the Trends placebo also serves for the Ads tests (unlike H1, where Ads tests could at most be inconclusive; this change was part of Amendment 3). The split-half check used the same two halves and rule as for H1. Holm correction was applied across the five confirmatory p-values. Support requires a Holm-significant result (p < .05), a passed placebo and a stable split-half result. The top-3 rate correlates with E_i (r = 0.69), so H2 is not independent of H1c.
2.6 Added test: recommendation position (H3, Amendment 4)
Tiers. Each response was coded by the brand’s first-mention position: 1, 2-3, or 4 or later. Each brand was then given a primary tier: T1 if its modal per-response tier was position 1, T2 if it was positions 2-3, T3 if it was position 4 or later, and T0 if it was never mentioned in any of its 30 responses. The modal tier was taken over the responses that mentioned the brand, with ties going to the worse tier. As exploratory alternatives we used tiers assigned by mean rank among mentions and a weighted score based on the share of runs in each tier. Cell sizes were T1 11, T2 24, T3 262 and T0 48 in Ads, and T1 11, T2 24, T3 249 and T0 43 in Trends. T1 is flagged as small (fewer than 15 brands).
Hypotheses.
- H3a (monotonic ordering, T1 > T2 > T3 > T0): a linear ordered contrast across tiers with category fixed effects and a category-clustered wild bootstrap. It also requires that every adjacent difference is non-negative. A within-category Jonckheere-Terpstra permutation test is reported as a secondary test.
- H3b: T1 vs T2 (is position 1 special?).
- H3c: the same contrast on current volume. This is cross-sectional.
Checks and decision rules. The pre-AI placebo fitted H3a and H3b on Trends growth for January 2015 to November 2022, and passes if the two-sided p for the H3a contrast exceeds 0.10. The split-half check and Holm correction across the five tests followed the H2 rules. H3a is supported in a source only if it is Holm-significant, the monotonicity requirement holds, the placebo passes and the split-half rule holds.
3. Results
3.1 Data and sample
All 3 Trends pulls x 493 terms x 141 months were collected, and the median between-pull coefficient of variation was 0.015. Analysis A used 327 brands; 20 low-volume brands were excluded because too many of their months were zero or missing. Analysis B used 345 brands, because Proton VPN and Topo Chico had no Ads data. At the monthly level the two sources agreed only modestly, with a median per-brand Spearman correlation of 0.49. In Ads, 4 of the 140 control terms (Cybersecurity & VPN) returned no data, leaving 136.
3.2 Branded and non-branded volume
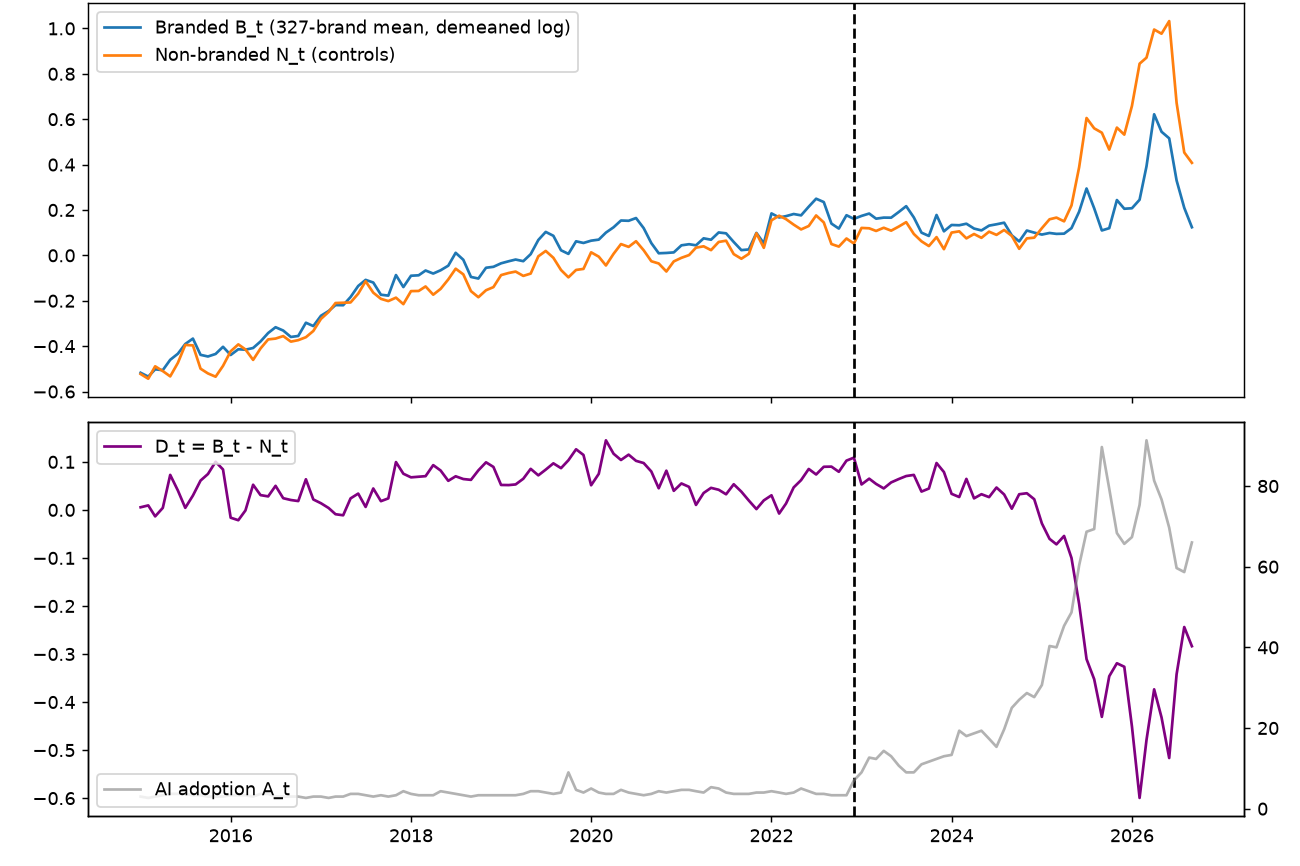
In Trends (Figure 1), the segmented model fitted to January 2015 to September 2026 gave a branded slope of +8.93 pp per year before December 2022 and +4.92 after (95% CI 0.20 to 9.63). The non-branded slope rose from +8.47 before to +21.13 after (95% CI 12.05 to 30.21).
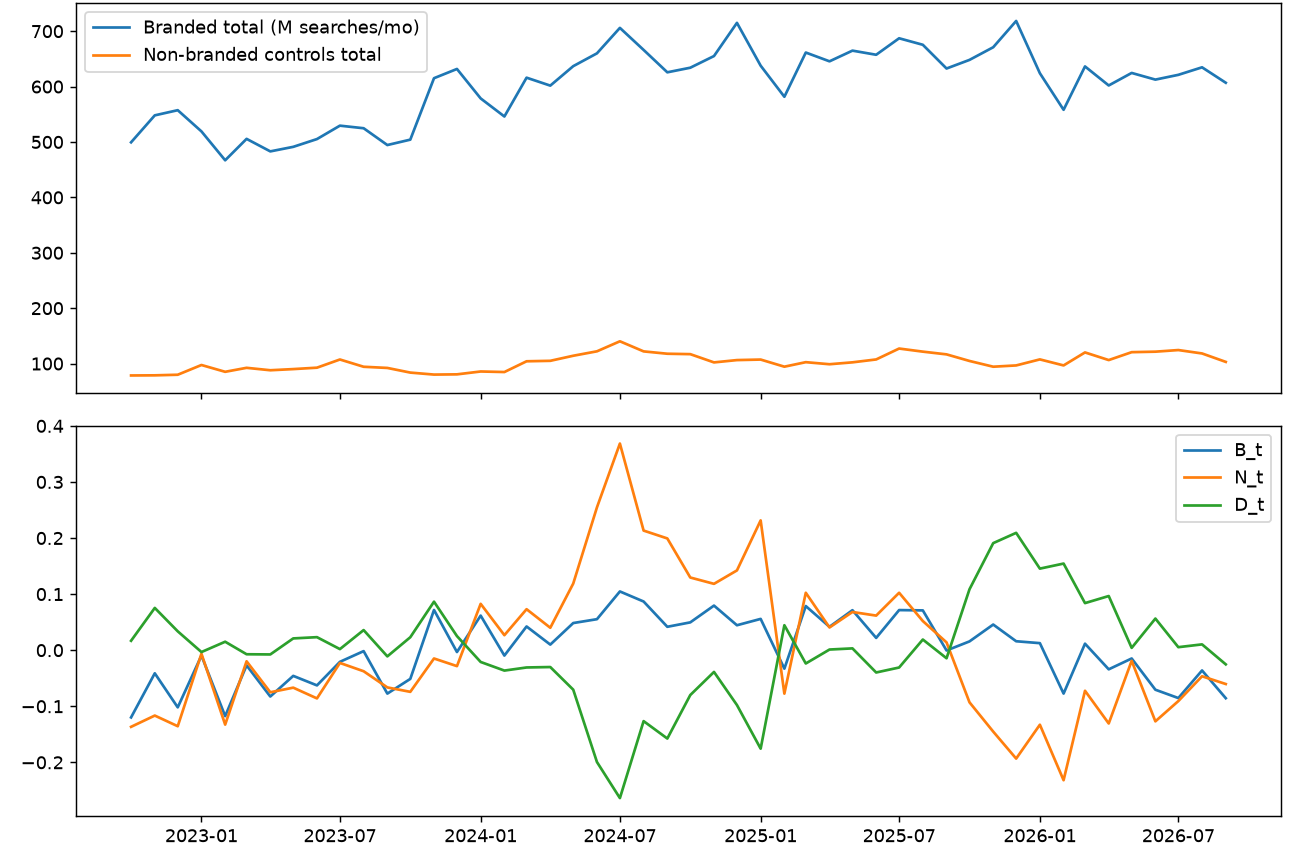
In Ads (Figure 2), total branded volume rose from 6.12 billion searches (October 2022 to September 2023) to 7.56 billion (October 2025 to September 2026), up 23.4%, while total non-branded control volume rose from 1.08 billion to 1.31 billion, up 22.1%. These totals are dominated by the largest brands. The typical brand trend (log-mean) was flat: branded +0.21 pp per year (95% CI -8.10 to 8.51) and non-branded -0.46 pp per year (95% CI -10.09 to 9.17).
3.3 Confirmatory tests
Table 2. Confirmatory results by source. Estimates are pp of annual growth (H1a, H1c) or correlation (H1b).
| Test | Estimate (95% CI) | One-sided p | Holm p | Additional criteria | Verdict |
|---|---|---|---|---|---|
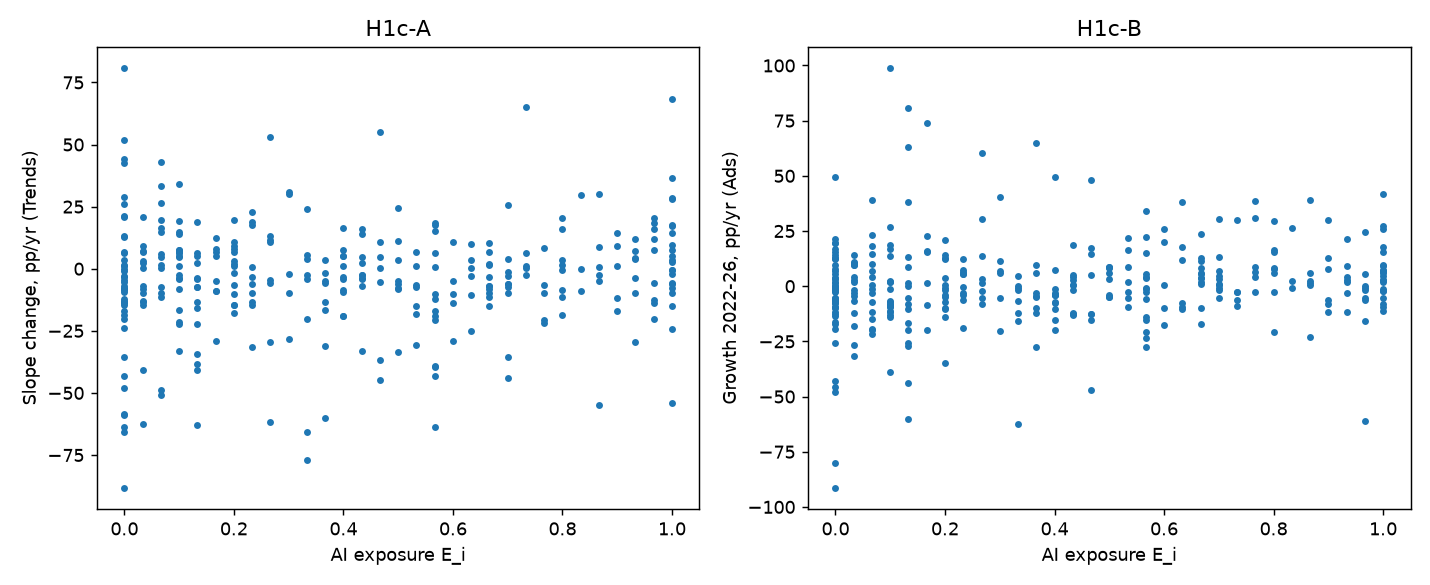
| H1c-A (Trends) | +2.13 (-0.82, 5.08) | .072 | .214 | Split-half fails (+3.14, p = .032; +0.11, p = .47). Placebo +1.73, two-sided p = .23. TOST fails. MDE 3.6 | Inconclusive |
| H1a-A (Trends) | -2.44 (-4.70, -0.19) | .98 | 1.00 | Without the AIO and AI Mode terms: -16.67 | Not supported; estimate in the opposite direction |
| H1b-A (Trends) | r = -.08 (-.37, .22) | 1.00 | 1.00 | Both halves non-significant | Not supported |
| H1c-B (Ads) | +2.28 (-1.15, 5.72) | .084 | .084 | Placebo cannot be tested. Halves +1.43 (p = .32) and +2.29 (p = .048). TOST fails. MDE 4.2 | Inconclusive |
| H1b-B (Ads) | r = .39 at lag 3 (.09, .62) | .017 | .034 | Split-half fails (p = .73, .32). Exploratory Granger tests: A to S p = .06; S to A p = .17 | Inconclusive (split-half fails) |
| H1a-B (Ads) | D_t slope +0.67 (-3.35, 4.68) | .37 | n/a | Descriptive only | No verdict |
Note. MDE = minimum detectable effect at 80% power. AIO = AI Overviews.
The exposure gradient is shown in Figure 3. All exploratory H1c variants were positive and none reached significance: excluding flagged brands gave +1.93 in Trends and +1.09 in Ads; moving the post date to March 2023 gave +2.00 in Trends; ChatGPT-only exposure gave +2.46 and +2.13; and Gemini-only exposure gave +1.63 and +2.25.
3.4 Agreement between sources (Analysis C)
Brand by brand (Figure 4), the sources disagreed under the pre-set rule. The Spearman correlation of per-brand growth was 0.39 (95% CI 0.29 to 0.49), and 64.9% of brands had the same sign in both sources (95% CI 59.8 to 69.8). Median brand growth was +4.0 pp per year in Trends and +0.2 in Ads.
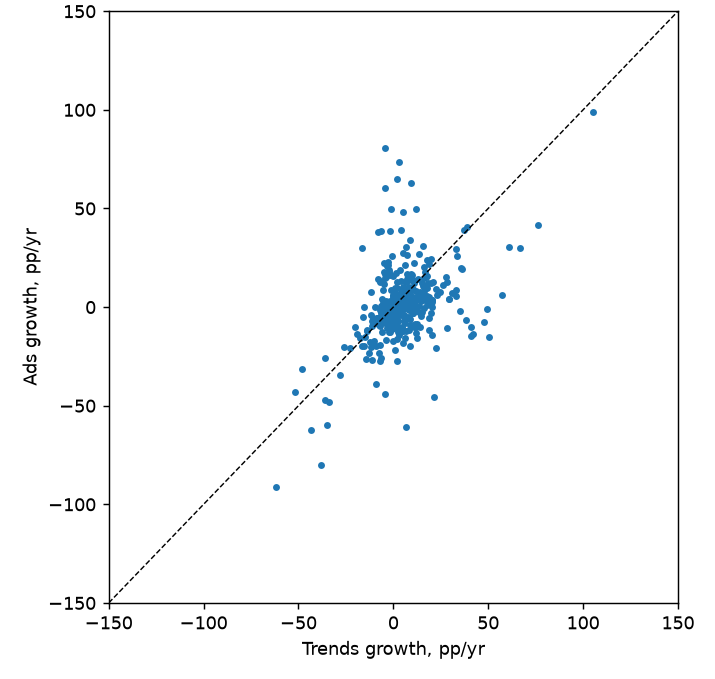
In aggregate, branded search was flat to slightly positive in both sources over the overlap window, with intervals spanning zero (+3.70 pp per year in Trends, 95% CI -4.66 to 12.07; Ads as in Section 3.2), but the branded-minus-non-branded series D_t did not agree (-4.30 in Trends, +0.67 in Ads).
Over the same window, the exposure gradients nearly coincided, at +2.15 in Trends and +2.28 in Ads (difference -0.13; category bootstrap 95% CI -3.06 to 3.00).
3.5 Exploratory: the 2025-2026 Trends uplift
From around June 2025, Trends showed a broad uplift across brands, head terms, “best X” terms and the neutral term “weather” (pulled as a check), with no counterpart in Ads and no documented change in Google’s methodology. It is consistent with a change in how Trends normalises its data rather than in user behaviour, but we cannot confirm the cause. Re-running all analyses with June 2025 to September 2026 excluded, or with a level-shift dummy from June 2025, changed no verdict: H1c-A was +3.04 and +2.94 (Holm p = .14 and .11), H1a-A stayed negative, H1b-B lost significance when the period was excluded, and the Spearman correlation between sources rose from 0.39 to 0.53.
3.6 AI “recommendation” and branded search (H2; added after H1, Amendment 3)
Table 3. H2 results. Estimates are pp of annual growth (H2a per SD of top-3 rate; H2b matched difference) or log points x 100 of current volume (H2c).
| Test | Estimate (95% CI) | One-sided p | Holm p | Split-half | Verdict |
|---|---|---|---|---|---|
| H2a-Ads (n = 345) | +2.36 pp (0.26 to 4.47) | 0.010 | 0.029 | half 1 +1.41 (p = 0.188); half 2 +3.74 (p = 0.001) | Inconclusive (split-half fails) |
| H2a-Trends (n = 327) | +3.00 pp (0.00 to 5.99) | 0.020 | 0.029 | half 1 +3.75 (p = 0.010); half 2 +1.42 (p = 0.215) | Inconclusive (split-half fails) |
| H2b-Ads (83 recommended of 345) | +7.13 pp (2.10 to 12.36) | 0.003 | 0.012 | half 1 +2.14 (p = 0.327); half 2 +9.88 (p < 0.001) | Inconclusive (split-half fails) |
| H2b-Trends (81 recommended of 327; 325 in matching) | +8.02 pp (1.68 to 15.53) | 0.013 | 0.029 | half 1 +5.24 (p = 0.159); half 2 +7.69 (p = 0.004) | Inconclusive (split-half fails) |
| H2c level (cross-sectional, n = 345) | +55.76 log points x 100 (37.64 to 73.87) | 0.0001 | 0.0005 | n/a | Association present (not causal) |
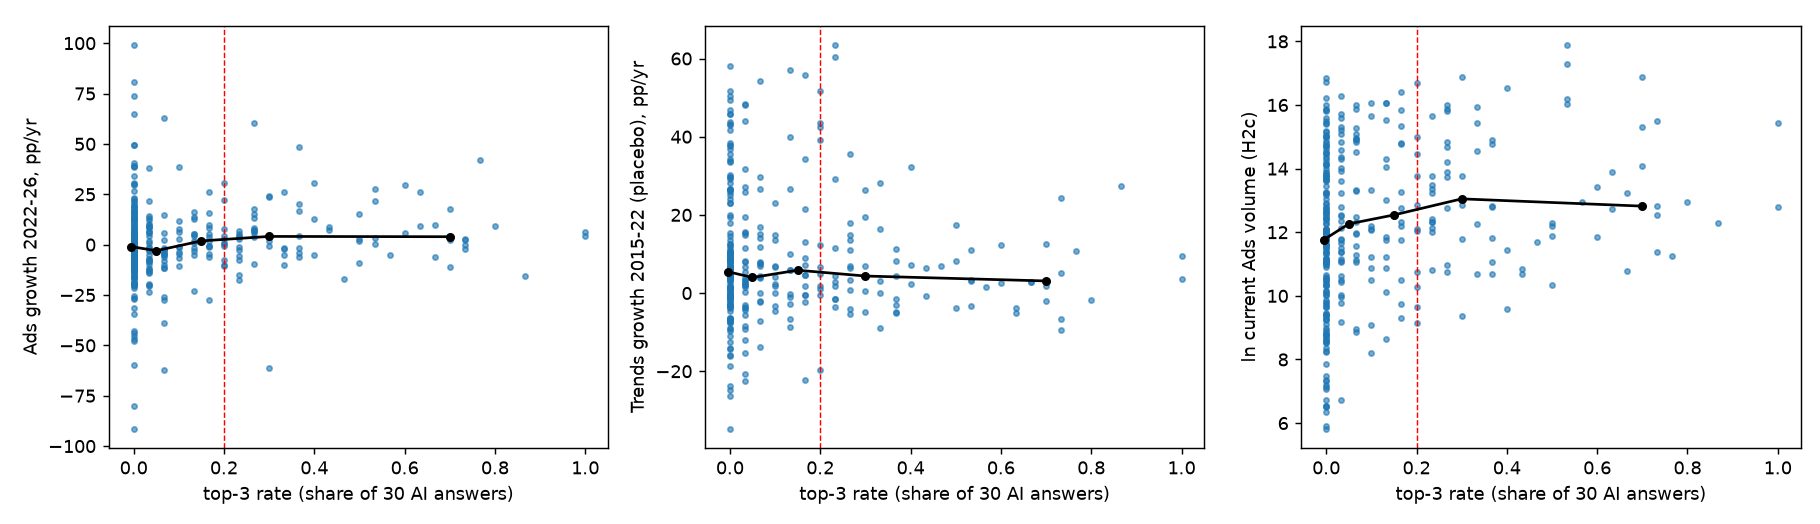
All four growth tests were significant after Holm correction, and the pre-AI placebo passed. In 2015-2022 Trends growth, the gradient per SD of top-3 rate was -0.66 pp (95% CI -2.19 to 0.87; two-sided p = 0.36), which passed the equivalence test (90% CI within ±2 pp), and recommended versus matched brands differed by +1.03 pp (95% CI -3.10 to 5.18; p = 0.62). However, each test was significant in only one of the two halves. For both Ads tests and H2b-Trends, the gap appeared mainly in the second half (from November 2024); for H2a-Trends, it appeared mainly in the first. Under the pre-specified rule, none of the four tests is therefore “supported”.
In exploratory checks, the gap grew with the threshold: at 0.10 it was +5.91 (Ads) and +7.58 (Trends), and at 1/3 it was +12.35 and +17.41. The top-1 rate gave +1.96 (Ads) and +2.50 (Trends) per SD. With the June 2025 level-shift dummy applied to both sources, H2a-Trends was +3.76 pp (95% CI 0.45 to 7.06; Holm p = 0.04), and both Ads tests had Holm p ≥ 0.13; under that dummy the Ads growth window loses its last 16 months of slope information. The data are shown in Figure 5.
3.7 Recommendation position (H3; added after H2, Amendment 4)
Table 4. H3 results. Estimates are pp of annual growth per tier step (H3a), the T1 minus T2 difference (H3b), or log points x 100 of current volume per tier step (H3c).
| Test | Estimate (95% CI) | One-sided p | Holm p | Monotone | Split-half | 80% MDE | Verdict |
|---|---|---|---|---|---|---|---|
| H3a-Ads | +5.42 (1.70 to 9.14) | 0.003 | 0.015 | yes | half 1 +6.82 (p = 0.006); half 2 +5.67 (p = 0.003) | 4.6 | Inconclusive (placebo fails) |
| H3a-Trends | +6.76 (-0.88 to 14.40) | 0.044 | 0.131 | yes | half 1 +7.07 (p = 0.013); half 2 +5.41 (p = 0.081) | 9.3 | Inconclusive (not Holm-significant; placebo fails) |
| H3b-Ads (T1 vs T2) | +1.55 (-13.25 to 16.36) | 0.409 | 0.409 | n/a | half 1 +2.87 (p = 0.439); half 2 -1.96 (p = 0.643) | 18.1 | Inconclusive (low power) |
| H3b-Trends (T1 vs T2) | +7.37 (-5.98 to 20.71) | 0.126 | 0.251 | n/a | half 1 +10.56 (p = 0.085); half 2 +1.60 (p = 0.396) | 16.3 | Inconclusive (low power) |
| H3c level (cross-sectional) | +69.45 (26.82 to 112.07) | 0.005 | 0.019 | yes | n/a | 52.1 | Association present (not causal) |
Note. MDE = minimum detectable effect.
Category-adjusted tier means, with 95% category-bootstrap CIs, are shown in Figure 6. For Ads growth they were T1 +7.9 (0.5 to 15.7), T2 +6.3 (-0.5 to 14.0), T3 +1.6 (0.6 to 2.8) and T0 -5.9 (-13.7 to -1.1). For the Trends slope change they were T1 +10.0 (-0.4 to 19.3), T2 +2.7 (-3.4 to 9.4), T3 -4.2 (-6.0 to -2.6) and T0 -10.1 (-23.9 to 0.6). For current ln Ads volume they were T1 13.7 (12.6 to 14.6), T2 12.7 (12.2 to 13.4), T3 12.3 (12.1 to 12.5) and T0 11.5 (10.6 to 12.1). The secondary Jonckheere-Terpstra tests agreed with the ordering (Ads p = 0.0038; Trends p = 0.0030).
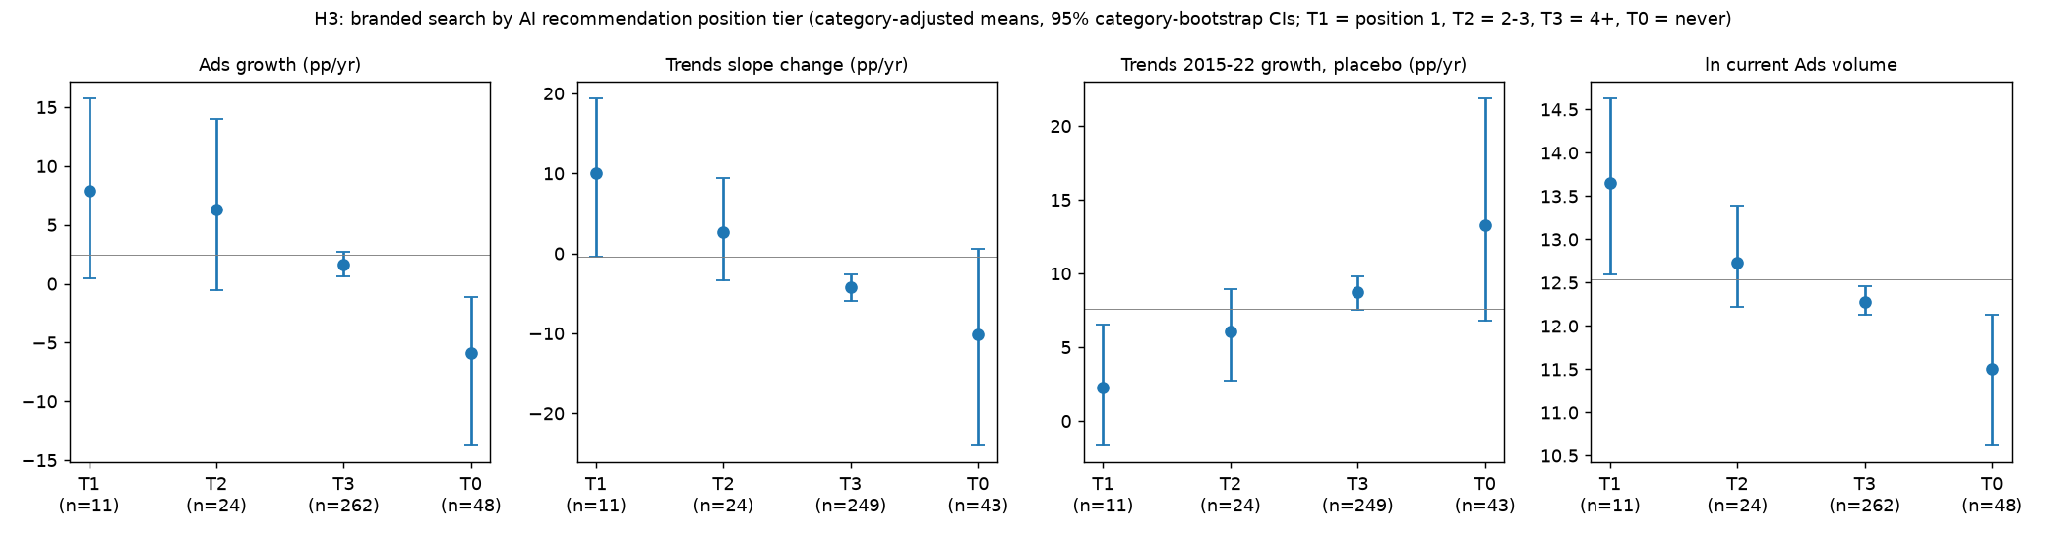
The pre-AI placebo did not pass. For 2015-2022 Trends growth, the ordered contrast was -3.70 (95% CI -7.74 to 0.34), with a two-sided p of 0.065, below the pre-specified 0.10 threshold (Section 2.6). The tier means were T1 +2.3 (-1.6 to 6.6), T2 +6.1 (2.7 to 8.9), T3 +8.7 (7.5 to 9.8) and T0 +13.3 (6.8 to 21.8). Before ChatGPT, then, the ordering tended to run the other way: brands that AI now names first or early had been growing more slowly, and never-mentioned brands fastest. Under the pre-specified rule, H3a-Ads is therefore not “supported”, even though it is Holm-significant, monotone and stable across halves.
Whether position 1 is special could not be resolved. The T1 minus T2 difference was small in Ads (+1.55) and imprecise in both sources, with 80% MDEs of 16 to 18 pp. Among the exploratory measures, alternative tiers gave Ads +6.73 and Trends +6.48, and the weighted tier score gave Ads +2.52 and Trends +2.77 per SD.
4. Discussion
4.1 Principal findings
No H1 test was supported (Table 2). Branded search did not gain share against non-branded search in either source, and the exposure gradient of about 2 pp per year per SD was imprecise: it could be neither confirmed nor ruled out.
4.2 The “already winners” interpretation
Three features of the data suggest that the exposure gradient may reflect selection rather than effect. A placebo break in 2019 gives a gradient of similar size (Table 2). The gradient was not stable across halves: in Trends it sat in the first half, in Ads in the second. And AI exposure was measured in October 2026, after the outcomes. AI engines may simply name brands that were already gaining attention. This fits Indig’s (2026a) finding that brands clearly leading a category’s ChatGPT mentions tend to have higher branded search volume than the runner-up, and his null result for the forward link (Indig, 2026b).
4.3 Relation to the branding account and panel studies
Our data do not rule out the individual-level journey that panel studies have observed (Section 1.1). Those findings concern individuals over a short window. By September 2026, any such journeys had not produced a shift in aggregate US branded search relative to non-branded search, or a dose-response by AI exposure, large enough for our tests to detect.
In our sample, brands that AI answers named early in October 2026 had grown faster since late 2022, by about 7 to 8 pp per year against matched brands, a gap not detected in 2015-2022 Trends data. It was not stable across the two post-launch halves, and recommended brands are already much larger (H2c). These results are compatible with a modest aggregate echo of an individual-level effect of the kind Iannelli (2026) describes, but they do not confirm it.
4.4 Is position linked to growth?
Brands that AI answers name first or early grew faster in 2022-2026 than brands named later or not at all, and in Ads the ordering held across both halves of the window. Three features stop us reading this as evidence that recommendation position drives branded search. First, the placebo reversed: before ChatGPT the ordering tended to run the other way, so the post-2022 ordering partly reflects a change in trend, which could come from AI exposure, from mean reversion among large, mature brands, or from other shocks to the same brands. Second, as with exposure, position was measured after the outcomes (Section 4.2). Third, first-position brands are much larger (H3c), so position, size and maturity are hard to separate.
4.5 Limitations and future research
Limitations
AI exposure was measured once (October 2026), using two engines and within-day repeats. Gemini answers were not US-localised (Section 2.3), but Gemini-only and ChatGPT-only exposure gave similar results (Section 3.3). Ads data are bucketed and smoothed, and have no pre-period. Trends is relative to total searches and shows a possible normalisation shift. “gemini” is an ambiguous adoption term. The sample is purposive, with unverified list membership and a knowledge-based event screen. The plan was frozen privately (Section 2.1), and the H2 and H3 tests were added after earlier results had been seen. The design is observational, so these results cannot establish causation. With 14 category clusters, power to detect an effect at the ±2 pp equivalence bound was low (80% MDE 3.6 to 4.2 pp).
Future research
- A longitudinal panel of AI recommendation positions (priority). The next study should re-measure positions repeatedly over time, with prompt sampling at fixed intervals, so that position is observed before the outcome window. It should use a panel design in which within-brand changes in AI position predict subsequent within-brand changes in branded search, with brand fixed effects absorbing size and maturity. It should add engines beyond ChatGPT and Gemini (for example Perplexity, Google AI Mode and AI Overviews), sample more position-1 brands, and deposit its plan with a public registry before any outcome data are seen.
- Mean reversion as a rival explanation. Future designs should model each brand’s pre-period trend explicitly, for example with difference-in-differences with brand-specific trends or synthetic controls, so that a post-2022 ordering cannot be produced by large, mature brands regressing to their own mean.
- Better data. Replications should use a consistently scaled Trends source (studies relying on either Trends or Ads alone should report the disagreement between them), engines that support country targeting, finer search data than bucketed Ads volumes, and markets with different AI adoption timing.
5. Conclusions
We found no confirmatory support for the view that AI search adoption has raised US branded search overall. Branded search did not gain share relative to non-branded search, and the broad exposure gradient was small, non-significant, and matched by a similar-sized but non-significant gradient before ChatGPT. Brands that AI answers name early showed faster branded growth since late 2022, but these tests were added after the earlier results were seen, and their results were either unstable across time (H2) or not supported by the pre-AI placebo (H3), so under our pre-specified rules they remain inconclusive. Whether being named first is linked to faster growth than being named second or third could not be resolved.
These patterns are compatible with a modest aggregate echo of the individual-level effects reported in industry studies. They are also compatible with AI engines favouring already-popular or recovering brands. Repeated measurement of AI recommendations over time, ideally before outcome periods, together with a consistently scaled Trends source, is needed to separate these explanations.
Declarations
Funding. No external funding. The work was carried out by Ranking Atlas.
Competing interests. The author runs Ranking Atlas, an AI search optimisation (AI SEO) agency that could benefit commercially from findings either supporting or questioning the value of AI visibility. To limit this conflict, the primary hypotheses (H1), analysis plan and decision rules were frozen before the outcome data were pulled, and the tests added later (H2, H3) are labelled as such.
Analysis plan. See Section 2.1 and Table 1.
Data availability. Data available from the author on request.
Author contributions. Daniel Grainger is the sole author and was responsible for the conceptualisation, methodology, analysis, writing and final approval of the paper.
Use of AI tools. The author designed the study. Grokbot, an AI agent made by xAI, collected the data via the DataForSEO API and ran the analysis. The author drafted the paper. Claude (Anthropic) was used to check the paper’s figures, quotes and references against their sources, and to edit the text. ChatGPT and Gemini were also the objects of study, as the engines whose answers were measured. The author reviewed all outputs and takes full responsibility for the content.
Ethics. This study used aggregate search data from public and commercial sources, and AI engine answers. No human participants or personal data were involved.
References
Goodwin, D. (2024). Rand Fishkin on the SEO opportunity pie shrinking and more insights. Search Engine Land. https://searchengineland.com/seo-opportunity-shrinking-rand-fishkin-448876. Retrieved October 24, 2026.
Iannelli, M. (2026, June 17). The prompt-to-purchase pipeline: What millions of search events told us about how AI influences buyer behavior. Scrunch. https://scrunch.com/blog/prompt-to-purchase-pipeline-how-ai-influences-buyer-behavior/. Retrieved October 24, 2026.
Indig, K. (2026a, July 20). Does topical authority matter in AI search? Growth Memo. https://www.growth-memo.com/p/does-topical-authority-matter-in. Retrieved October 24, 2026.
Indig, K. (2026b, October 19). Does AI drive more direct traffic? Growth Memo. https://www.growth-memo.com/p/does-ai-drive-more-direct-traffic. Retrieved October 24, 2026.
Kehoe, A. (2026, June 23). Being recommended in AI makes users 2.5x more likely to visit your site. Similarweb. https://aisearch.similarweb.com/blog/ai-visibility-downstream-impact/. Retrieved October 24, 2026.
Seer Interactive. (2026, July 16). The Signal - July 2026: AI AMA with Wil Reynolds and Alisa Scharf [Webinar recap]. https://www.seerinteractive.com/events/event-recap-the-signal-july-2026. Retrieved October 24, 2026.
Silva, C. (2026, May 20). How to measure and report on AI search visibility (what actually matters). Semrush. https://www.semrush.com/blog/measure-ai-visibility/. Retrieved October 24, 2026.
Cite this paper
Grainger, D. P. (2026). Is AI engine exposure associated with rising branded search? A two-source study of 347 US brands, 2015-2026, with a pre-specified analysis plan. Zenodo. https://doi.org/10.5281/zenodo.23636267
The text of this paper is licensed under Creative Commons Attribution 4.0 International (CC BY 4.0).
Not peer reviewed.