
Brands ranked in the top three positions by AI engines in October 2026 had faster branded search growth from ChatGPT's launch in 2022 than brands outside the top three positions: exploratory evidence from 418 US brands.

RA-WP-2026-03
Structured abstract
Background. When people ask an AI engine which product to buy or which service to use, it answers with a short list of brands in order. Practitioners describe this as a branding channel: people meet a brand in an AI answer, then search for it by name on Google. If position in these lists is linked to later searches, brands placed near the top should show faster growth in branded search. Our earlier study of 347 US brands found that brands ChatGPT and Gemini recommended grew about 7 pp per year faster in Google Ads searches than matched brands, but the result was unstable over time (Grainger, 2026).
Methods. We measured recommendation position again with five engines (ChatGPT, Gemini, Google AI Mode, Google AI Overviews and Perplexity) and 280 brand-free category prompts, run six times each on 23-24 October 2026 (8,190 answers). Each of 418 US brands was placed in a band: position 1, positions 2-3, position 4 or later, or not named. We compared these bands with each brand’s Google Ads search volume growth from October 2022 to September 2026, a window that begins two months before ChatGPT’s public launch on 30 November 2022, which we treat as the start of mainstream AI engine use. Google Trends was a second source, and 2015-2022, before ChatGPT, a placebo period. Growth is reported in pp of annual growth (100 x the yearly change in ln volume; 1 pp is roughly 1% per year). Positions are a single October 2026 snapshot compared retrospectively with earlier growth; past AI answers cannot be reconstructed.
Results. The 68 brands placed in the top three grew 8.2 pp per year (about 8.5% a year) faster than the other 350, after controlling for category and starting volume (95% CI 3.3 to 13.2). Google Trends gave a similar estimate (+7.9; 95% CI 1.7 to 14.1). In 2015-2022, before ChatGPT’s launch, no growth advantage was detected (-1.6; 95% CI -5.3 to 2.1). The gap appeared in both halves of the post-ChatGPT period in Ads (+11.1 and +7.4). None of the pre-specified tests was supported: brands at position 1 and at positions 2-3 grew at similar rates, and the rank-ordering test was not significant after Holm correction. In post hoc checks, the gap was similar when compared with brands of the same starting volume (7.6 to 8.7 pp), and 10 of 12 randomly drawn top-3 brands grew faster than their category median.
Conclusions. Brands that AI engines place in the top three have grown faster in branded search since ChatGPT’s public launch, on two data sources and in both halves of the period, with no detectable gap before ChatGPT. The comparison was chosen after the data were seen, so the result is an association, not evidence that AI ranking causes search growth. A prospective study that measures position first will be preregistered publicly.
Keywords: AI search; answer engines; brand recommendations; branded search; Google Ads; Google Trends; recommendation position
1. Introduction
1.1 AI engines as a branding channel
A widely held view among search marketers is that AI search works as a brand-discovery channel. People ask an AI engine for a recommendation, see a short list of brands, and then search for those brands by name on Google. Tool vendors and agencies have suggested branded search volume as a way to measure the value of AI visibility (Goodwin, 2024; Seer Interactive, 2026; Silva, 2026).
Panel studies support the individual-level journey. In one, users who received a ChatGPT brand recommendation were 2.5 times as likely to visit that brand’s site within seven days as a direct competitor’s, and about 56% of those visits arrived via search (Kehoe, 2026). In another, people who had an AI platform recommend a brand they had no recent sign of using became about 182% more likely to search for it on Google within a week (3.28% to 9.24%; Iannelli, 2026).
1.2 AI engines since November 2022
ChatGPT was released to the public as a free research preview on 30 November 2022 (OpenAI, 2022). It was estimated to be the fastest-growing consumer app to that date (Hu, 2023), and within four months Perplexity, GPT-4 and Google’s Bard had followed. By mid-2025 AI answers also sat inside Google Search itself, through AI Overviews and AI Mode (Table 1). This paper therefore treats 30 November 2022 as the start of mainstream AI engine use, and compares branded search growth after it with growth before it.
Table 1. Releases of the AI engines studied and their predecessors, in date order. Sources are company announcements, or for Perplexity a co-founder’s launch post.
| Date | Event | Source |
|---|---|---|
| 30 Nov 2022 | ChatGPT released to the public as a free research preview | OpenAI (2022) |
| 7 Dec 2022 | Perplexity launches its public answer engine | Srinivas (2022) |
| 14 Mar 2023 | GPT-4 released in ChatGPT for paying subscribers | OpenAI (2023) |
| 21 Mar 2023 | Google opens access to Bard in the US and UK | Hsiao and Collins (2023) |
| 8 Feb 2024 | Bard renamed Gemini; Gemini rolls out on Android and iOS in the US | Hsiao (2024) |
| 14 May 2024 | AI Overviews begin rolling out to everyone in the US | Reid (2024) |
| 31 Oct 2024 | ChatGPT search launched for paying users; extended to all logged-in users on 16 Dec 2024 and to everyone on 5 Feb 2025 | OpenAI (2024) |
| 20 May 2025 | AI Mode begins rolling out to everyone in the US | Reid (2025) |
How many people use AI engines. Usage grew quickly, though it is measured in different ways and several figures come from the companies themselves:
- ChatGPT was estimated to have about 100 million monthly users in January 2023, two months after launch (UBS analyst estimate from Similarweb traffic data; Hu, 2023).
- A study using OpenAI’s internal data reports more than 100 million logged-in weekly active users after one year, almost 350 million after two years, and more than 700 million by the end of July 2025, nearly 10% of the world’s adults; practical guidance, seeking information and writing were the three most common conversation topics (Chatterji et al., 2025; six of the seven authors are affiliated with OpenAI).
- Perplexity reported 10 million monthly visits and 2 million unique visitors in February 2023 (company-reported; Wiggers, 2023).
- Google reported that AI Overviews had over 1.5 billion users by May 2025 (company-reported; Pichai, 2025).
- In Pew Research Center surveys, the share of US adults who had ever used ChatGPT rose from 18% in July 2023 (Pew Research Center, 2023) to 23% in 2024 and 34% in February-March 2025; 26% of all US adults had used it for learning (Pew Research Center, n.d., 2025).
- In nationally representative US surveys in August and November 2024, nearly 40% of adults aged 18-64 used generative AI (Bick et al., 2024).
These figures describe how widely AI engines are used, not how often people use them to choose brands.
1.3 Why position might be linked to search
AI answers are ordered lists, and order is linked to attention in other ranked lists. In web search, people look at and click the top results far more often than lower ones (Joachims et al., 2005; Craswell et al., 2008). In a field experiment on Expedia, where hotel rankings were randomised, position changed which hotels people looked at, though not what they bought once they had looked (Ursu, 2018). In paid search, position effects were real but much smaller than simple comparisons suggest (Narayanan and Kalyanam, 2015). If the same holds for AI answers, brands placed first or near the top should gain more branded searches than brands placed lower or not named.
1.4 Prior evidence on position in AI answers
Direct evidence is thin. Indig (2026a) found that, in Semrush data on ChatGPT, the clear leader in a category’s mentions had higher branded search volume than the runner-up in 55.7% of pairs, a cross-sectional association. When Indig (2026b) tested whether AI visibility predicted later branded search for four brands, he could not establish a reliable link.
Our earlier study (Grainger, 2026) measured how often ChatGPT and Gemini named 347 US brands and compared this with branded search growth. In tests added to that study, brands named among the first three sample brands in at least 20% of their answers grew 7.1 pp per year faster in Google Ads than matched brands (95% CI 2.1 to 12.4), and Ads growth was ordered by position tier (+5.4 pp per tier step). Neither met that study’s decision rules. The gap was concentrated in one half of the post-ChatGPT period, and before ChatGPT the position ordering ran the other way: brands later named first had been growing more slowly. Position-1 brands were too few (11) to tell whether first place is linked to more growth than second or third.
1.5 This study
This study measures position again, more thoroughly: five engines instead of two, 280 prompts instead of 70, and six runs per prompt instead of three. It uses mostly the same brands (344 of 418) and the same outcome window, so it is not an independent replication. What is new is the measurement of position.
The data were collected under a pre-specified plan, frozen before data collection, which named position 1 versus positions 2-3 as the primary test, plus a rank-ordering test, an engine-consistency test, a 2015-2022 placebo and equivalence tests. All are reported in Section 3.1. After seeing those results, including the top-3 versus rest contrast itself, we chose the comparison this paper focuses on:
Exploratory hypothesis. Brands placed in the top three recommendation positions show higher US branded search growth (October 2022 to September 2026) than brands outside the top three, conditional on category and starting volume.
What this design can and cannot show. Positions are a single snapshot taken in October 2026. We compare each brand’s current position retrospectively with its branded search growth since 2022. AI answers from earlier years cannot be reconstructed, so we cannot observe where a brand stood in 2023 or 2024, or whether it reached the top three before or after it grew. The study can show whether today’s top-3 brands are the ones that grew; it cannot show which came first.
2. Methods
2.1 Order of events
The brand sample and analysis plan were frozen before any answers were collected. The search data for the 345 earlier-sample brands on the frozen list had already been analysed in Grainger (2026).
2.2 AI answers
We wrote 280 prompts, 20 in each of 14 categories. No prompt named a brand. Five categories (quick-service restaurants; grocery and convenience; fuel, auto services and utilities; household cleaning and paper; soft drinks and beer) were labelled “low-AI comparison” in the frozen brand sample, as categories where people are thought less likely to ask AI engines for advice.
Each prompt was sent three times to each of five engines in each of two waves, through DataForSEO with the location set to the US and the language to English:
- ChatGPT and Gemini, via the LLM Scraper (models reported as “gpt-6” and “3.5 Flash-Lite”);
- Google AI Mode, via the SERP API;
- Google AI Overviews, via the organic SERP API;
- Perplexity, via LLM Responses (model “sonar”).
The US location was requested for every engine. For ChatGPT, Gemini, AI Mode and AI Overviews, every response we checked returned the US location code; Perplexity’s web search was set to the US.
Of 8,400 calls, 8,190 returned an answer. Brands and their order were extracted with a frozen prompt to gpt-4.1-mini-2025-04-14 at temperature 0. The extractor read answers in at most nine chunks of 500 characters, so about 15.6% of answers were cut short (Table 5 note); Section 3.4 reports results without them.
2.3 Position bands
A cell is one brand, one engine and one prompt. A brand’s position in a cell is its median position over the runs, with runs that did not name it counted as not named. Each cell is placed in one of four bands: position 1, positions 2-3, position 4 or later, or not named. Each brand then takes its most common band over the cells where it was named, with ties going to the worse band. Brands never named in any cell are “not named”. “Top 3” means position 1 or positions 2-3. A brand’s mean position is the average of its cell medians over the cells where it was named, so it can differ from its band.
The 418 brands split into 18 at position 1, 50 at positions 2-3, 222 at position 4 or later, and 128 not named. Top-3 brands were named in a median of 16 cells (range 1 to 93), and position 4+ brands in a median of 7 (range 1 to 92). Of the 290 named brands, 105 were named in fewer than 5 cells.
2.4 Brands
The brand list has 419 entries with usable Google Ads data: 345 from the earlier study’s sample and 74 new brands found in this study’s answers. The new brands were chosen with an earlier rule-based extraction pass, before any outcome data were pulled. That pass took every new brand it found at positions 1-3 (34 with usable data) and random draws of new brands at lower positions (40 with usable data). All brands were then banded with the final extraction. Under it, 26 of the 34 stayed in the top three and 29 of the 40 lower-position brands came out as not named.
“Sonic drive in” (earlier sample, not named) and “sonic drive-in” (new, positions 2-3) are the same brand, with identical Ads data in all 48 months. We dropped the not-named copy, leaving 418 brands: 68 in the top three and 350 outside it.
2.5 Outcomes
Google Ads growth (primary). US monthly search volume for each brand name, October 2022 to September 2026 (DataForSEO). Growth is the slope of ln(monthly volume) on time in years, with calendar-month fixed effects.
Why the window starts in October 2022. The Google Ads data cover at most four years of history (DataForSEO, n.d.), so the window is the 48 months from October 2022 to September 2026. It begins two months before ChatGPT’s public launch (Section 1.2) and covers four complete October-to-September years, so each calendar month appears four times in the calendar-month fixed effects. Starting the window in December 2022 instead gives a slightly larger first-half estimate (Table 5 note).
Google Trends (secondary). US monthly web search index, January 2015 to September 2026, one keyword per request, the median of three pulls. The outcome is the change in the slope of ln(index + 1) after December 2022. 371 brands have both Trends and Ads data.
Placebo. The slope of ln(Trends index + 1) from January 2015 to November 2022, the month of ChatGPT’s launch. If top-3 brands were already growing faster before AI answers existed, it should show here.
Units. All growth figures are pp of annual growth: 100 x the yearly change in ln volume (log points per year), so +8.2 pp means about 8.5% faster growth per year (e^0.082 - 1). This is the unit used in Grainger (2026).
2.6 Analysis
The headline model regresses each brand’s growth on a top-3 indicator, with fixed effects for the 14 categories and the log of starting volume (mean monthly Ads volume, October 2022 to September 2023). Standard errors are HC3. We also report the pre-specified estimator, which uses category fixed effects without the size control and a wild cluster bootstrap by category (14 clusters, Webb weights, 4,999 replications), because conventional cluster-robust p-values are unreliable with 14 clusters. The headline model, with its size control and HC3 errors, was not in the plan; both estimators are reported.
Checks: brands named only; position bands separately; AI-relevant versus low-AI categories; a control for each brand’s 2015-2022 trend; trimming and size limits; earlier-sample brands only; bands rebuilt without cut-short answers; a minimum number of named cells; ChatGPT-only bands; a rule-based extractor that reads the full text; parent-brand roll-ups; growth estimated separately in each half of the post-ChatGPT period (to October 2024 and from November 2024); and the Trends uplift from June 2025 noted in Grainger (2026), handled by excluding June 2025 onwards or by adding a level shift from June 2025. We also left out each category and each brand in turn, dropped the most influential brands, and clustered standard errors by parent company. None of these is adjusted for multiple testing.
2.7 Exploratory, post hoc additions
None of the analyses in this section was in any plan. All were added after the results above were known.
Start versus end. Using size controls collected for 413 of the 418 brands (five brands whose official website could not be identified were excluded), we fitted the same model to the level of branded search at the start (ln mean monthly Ads volume, October 2022 to September 2023) and at the end (October 2025 to September 2026), and to the difference. That model uses category fixed effects and size controls measured in October 2026 (backlink domain rank, stock-exchange listing, parent company and shared parent domain), with a wild cluster bootstrap by category (14 clusters, Webb weights, 9,999 replications). We repeated it with a web-mentions control, with domain rank only, and with category only.
Regression to the mean. Brands measured at a temporarily low point tend to rise afterwards, whatever their AI position. We refitted the headline model with starting volume controlled more flexibly (deciles; a cubic spline with 5 degrees of freedom), added a top-3 x starting-volume interaction, and matched each top-3 brand to a non-top-3 brand in the same category with nearly the same starting volume (within-category residual of ln starting volume, caliper 0.25 SD, nearest neighbour with replacement). Inference uses the same wild cluster bootstrap; the matched-pairs interval uses a sign-flip bootstrap of pair differences by category.
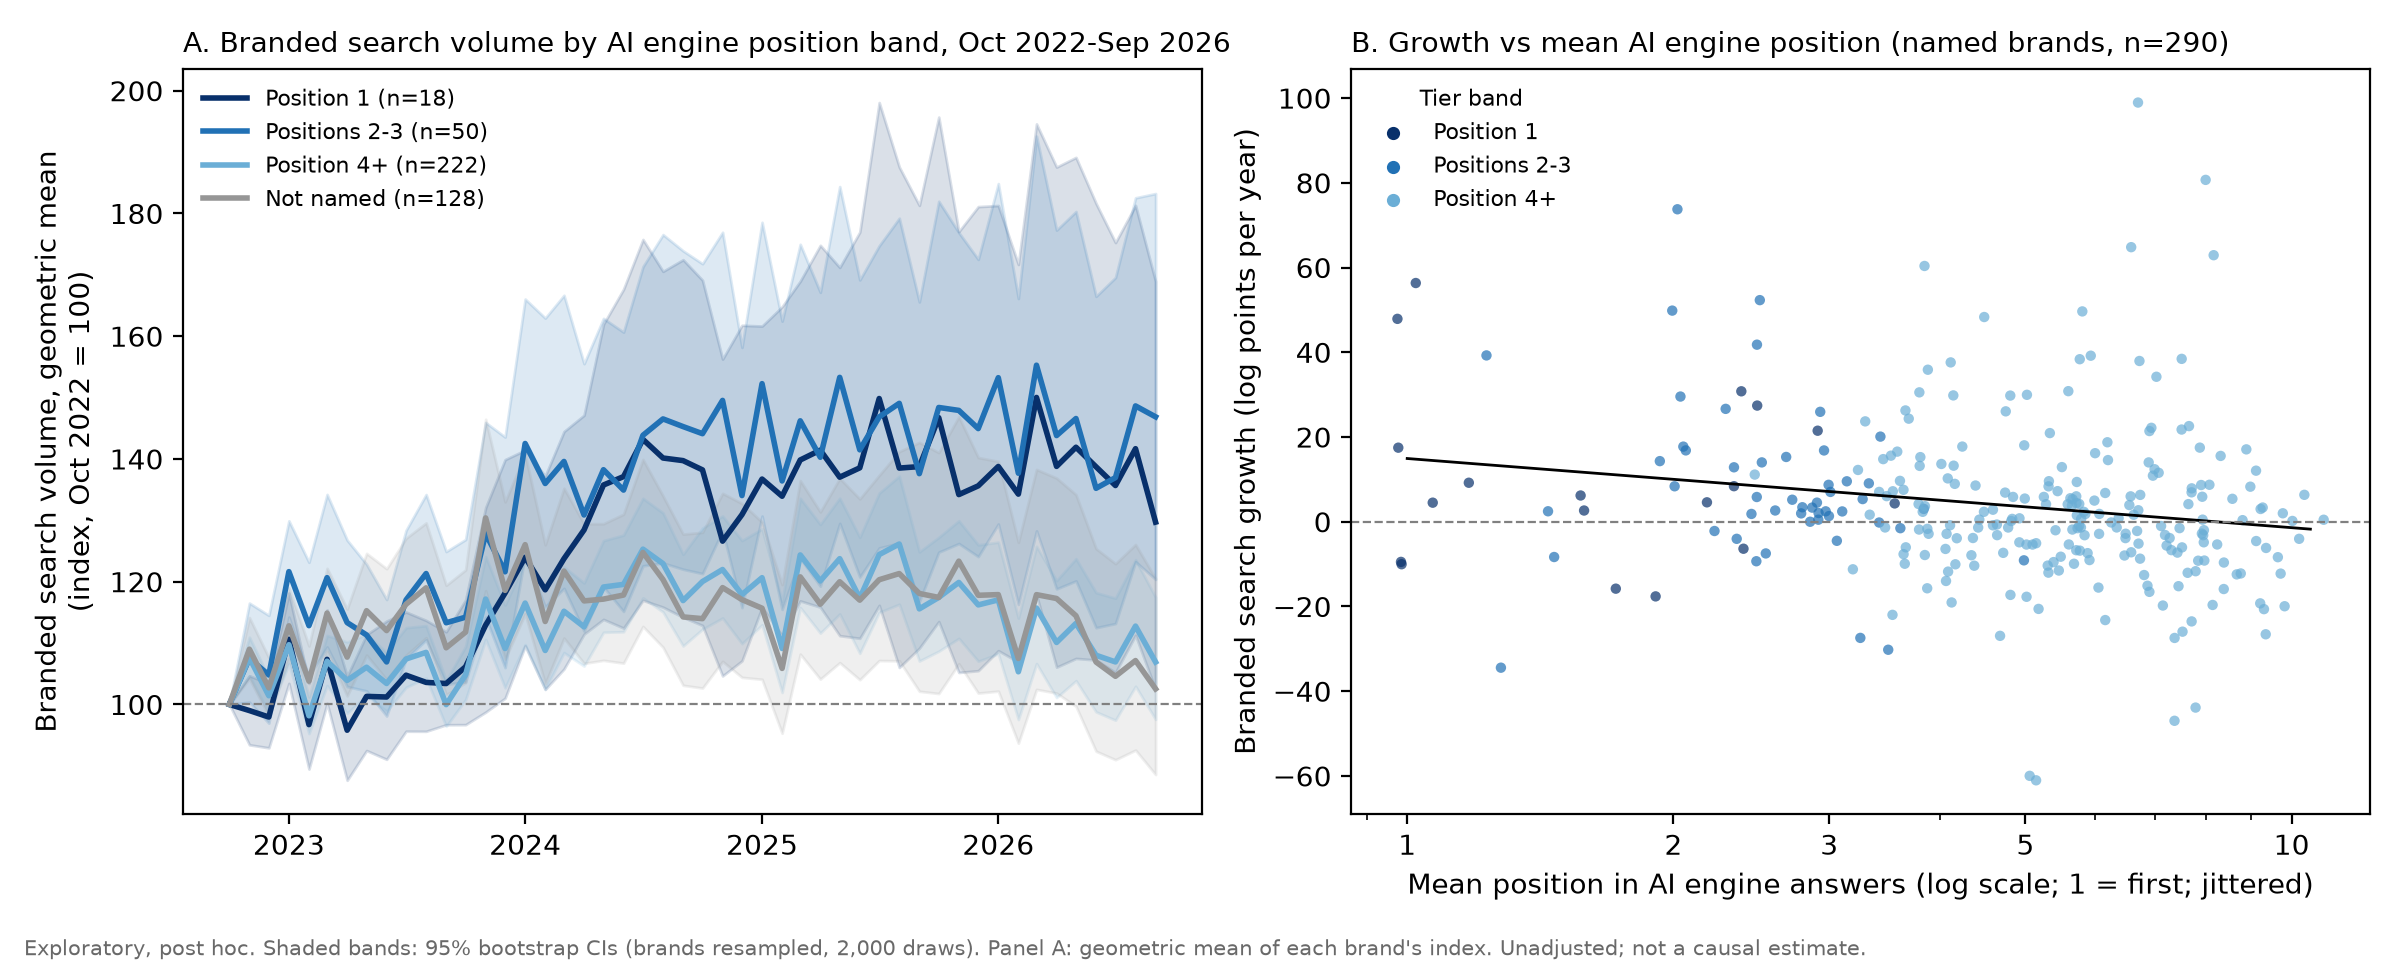
Volume by band. For each brand, monthly Ads volume was indexed to October 2022 = 100. Because Ads volumes are rounded into buckets, monthly medians move in steps, so we plot the geometric mean of the brand indexes in each band, with 95% bootstrap intervals (brands resampled, 2,000 draws).
Case studies. Each case-study rule was written to a file and hashed before the brands it chose were known:
- Rule-based case: the top-3 brand whose growth gap over the median of non-top-3 brands in its category is closest to the median gap across all top-3 brands; ties broken alphabetically.
- Random draw 1: 2 of the 67 other top-3 brands, seed 7301.
- Random draw 2, added after the first three brands had been seen: 10 of the remaining 65 top-3 brands, seed 58213.
All drawn brands are reported, whatever their series show. Each is compared with the monthly median index of non-top-3 brands in its category. A brand “beats its category” if its Ads growth exceeds the median growth of non-top-3 brands in its category.
3. Results
3.1 Pre-specified tests
None of the pre-specified tests was supported (Table 2). Position 1 did not beat positions 2-3: in Ads the difference went the other way (-2.6 pp; 95% CI -15.3 to 10.1). The rank-ordering slope was positive in Ads (+3.2 pp per band) but not significant after Holm correction (p = 0.072), and weaker in Trends. A second ordering test named in the plan, Jonckheere-Terpstra, was significant for Ads (one-sided p = 0.001) but sat outside the Holm-corrected set and does not allow for category-level dependence, so we treat the slope test as the confirmatory one. The ordering had the same sign on all five engines, but no engine was significant after correction. The 2015-2022 placebo showed no ordering (-0.7 pp). Equivalence tests were inconclusive, so a small effect cannot be ruled out.
Table 2. Pre-specified tests. Wild cluster bootstrap, category fixed effects; pp of annual growth.
| Test | Outcome | n | Estimate | 95% CI | p | Result |
|---|---|---|---|---|---|---|
| Primary: position 1 vs 2-3 | Ads | 419 | -2.6 | -15.3 to 10.1 | 0.66 (1-sided) | Not supported |
| Position 1 vs 2-3 | Trends | 374 | -3.7 | -17.9 to 10.6 | 0.70 (1-sided) | Not supported |
| Ordering, per band | Ads | 419 | +3.2 | 0.3 to 6.2 | 0.018; Holm 0.072 | Not significant after Holm |
| Ordering, per band | Trends | 374 | +2.4 | -2.1 to 6.9 | 0.14; Holm 0.43 | Not supported |
| Ordering, Jonckheere-Terpstra (outside Holm set; unadjusted) | Ads; Trends | 419; 374 | 0.001; 0.14 | Ads only | ||
| Ordering by engine | Ads, 5 engines | 419 | +1.1 to +2.0 | all include 0 | Holm 0.36 | Same sign; none significant |
| Ordering by engine | Trends, 5 engines | 374 | +0.5 to +3.0 | ChatGPT 0.2 to 5.7; others include 0 | Holm 0.09 to 0.49 | Same sign; none significant after Holm |
| Placebo, ordering 2015-2022 | Trends | 374 | -0.7 | -3.4 to 2.0 | 0.61 (2-sided) | No pre-trend |
| Equivalence, bounds +/-2 pp | Ads, Trends | 90% CIs not inside bounds | Equivalence not established |
Note. The Holm adjustment across engines was computed by us from the pipeline’s one-sided p-values. Rows use the frozen 419-brand list, which includes both Sonic entries. The 374 Trends brands include the Sonic duplicate and two brands without usable Ads data.
3.2 Top three versus the rest
Brands in the top three grew 8.2 pp per year faster in Ads than other brands in the same category with similar starting volume (Table 3). The raw medians tell the same story: top-3 brands grew 4.6 pp per year, the rest 0.2 (Cliff’s delta 0.23; 95% CI 0.09 to 0.37). The pre-specified estimator gave 8.4, and Google Trends gave 7.9. Figure 1 shows both groups over time, against the AI engine releases in Table 1 (Section 4.6).
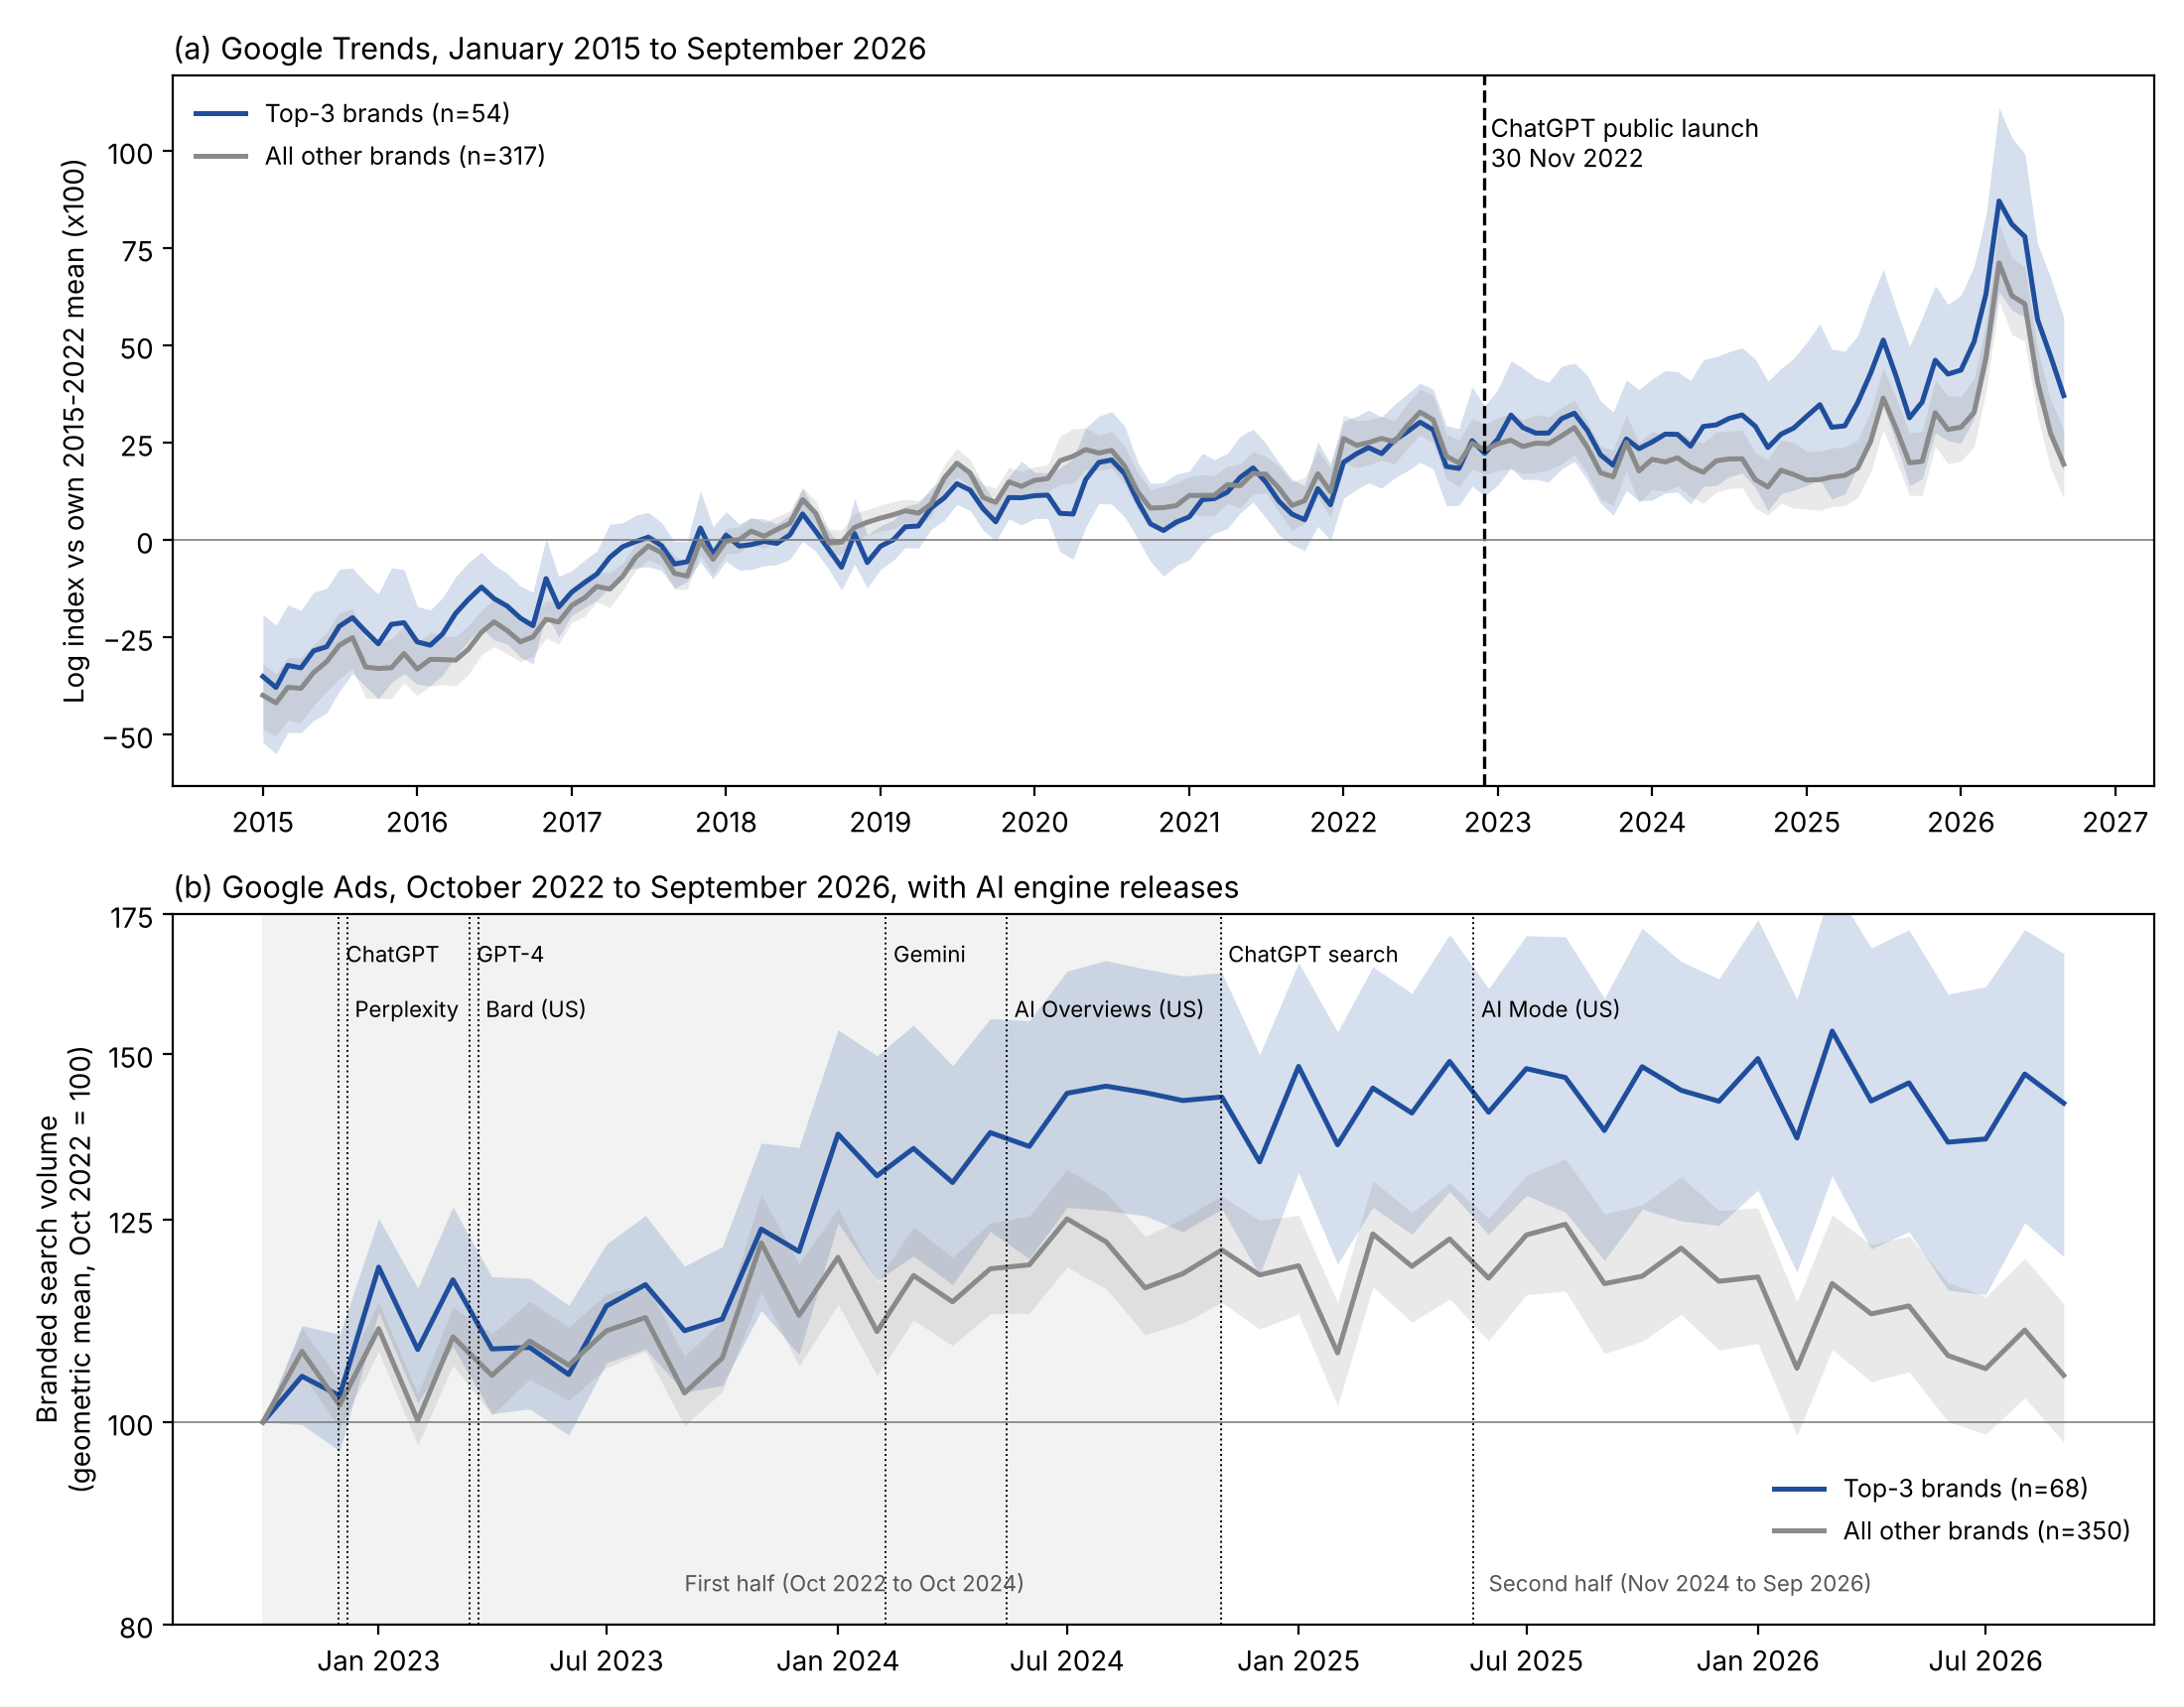
From 2015 to 2022 no gap was detected: top-3 brands grew 1.6 pp per year slower than the rest in Trends, with an interval that includes zero (-5.3 to 2.1). Controlling for each brand’s own 2015-2022 trend left the estimate at 7.0 in Ads and 6.3 in Trends. Comparing top-3 brands only with brands named at position 4 or later, and leaving out unnamed brands, gave 6.5.
Table 3. Top-3 coefficient, pp of annual growth. OLS with category fixed effects and log starting volume, HC3, unless noted.
| Specification | n (top 3) | Estimate | 95% CI | p |
|---|---|---|---|---|
| Ads growth (headline) | 418 (68) | 8.2 | 3.3 to 13.2 | 0.001 |
| Ads, pre-specified estimator (wild bootstrap) | 419 (68) | 8.4 | 3.4 to 13.3 | 0.003 |
| Trends slope change after Dec 2022 | 371 (54) | 7.9 | 1.7 to 14.1 | 0.012 |
| Trends, pre-specified estimator (wild bootstrap) | 374 (54) | 7.0 | 0.7 to 13.2 | 0.029 |
| Placebo: 2015-2022 Trends slope | 371 (54) | -1.6 | -5.3 to 2.1 | 0.40 |
| Placebo, pre-specified estimator (wild bootstrap) | 374 (54) | -1.8 | -5.0 to 1.4 | 0.23 |
| Ads, with 2015-2022 trend control | 371 (54) | 7.0 | 2.1 to 11.9 | 0.005 |
| Trends, with 2015-2022 trend control | 371 (54) | 6.3 | 1.7 to 11.0 | 0.007 |
| Named brands only: top 3 vs position 4+ (Ads) | 290 (68) | 6.5 | 1.7 to 11.3 | 0.008 |
3.3 Bands and categories
The point estimates look more like a step at the top-three boundary than a steady gradient (Table 4), though the intervals are too wide to tell the two apart. Compared with unnamed brands, position-1 brands grew 9.7 pp per year faster and positions 2-3 brands 10.5 pp faster, while position 4+ brands grew 3.3 pp faster, with an interval that includes zero. First place showed no advantage over second or third.
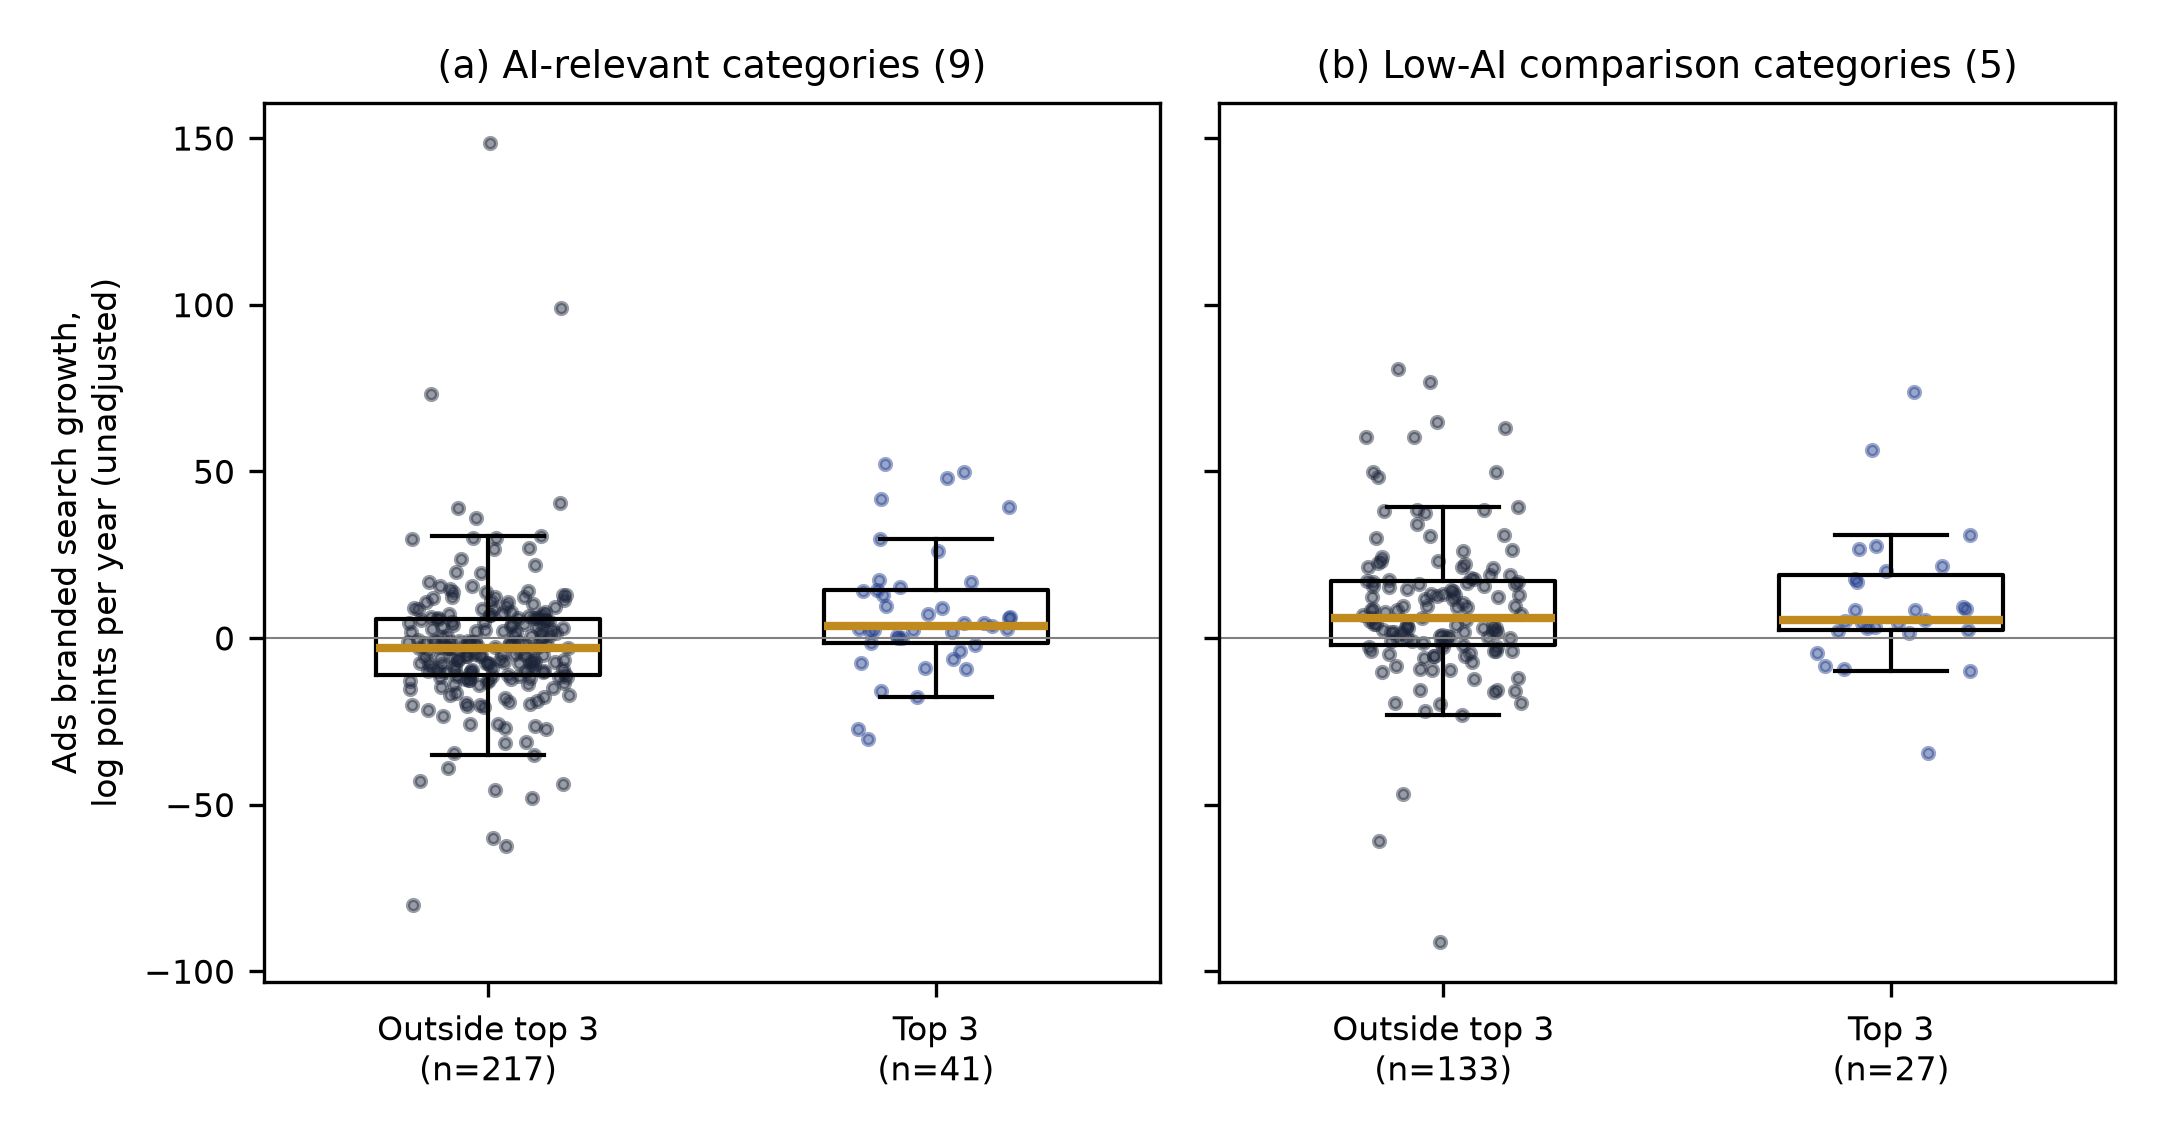
The gap was larger in the nine AI-relevant categories (10.9 pp) than in the five low-AI categories (4.1 pp). The difference between them is not significant (interaction -6.9; 95% CI -17.4 to 3.7). Figure 2 shows the brand-level data.
Table 4. Bands and category groups. Ads, pp of annual growth, OLS with category fixed effects and log starting volume, HC3, n = 418.
| Specification | Estimate | 95% CI | p |
|---|---|---|---|
| Top 3, AI-relevant categories (n = 258; 41 top 3) | 10.9 | 5.0 to 16.8 | <0.001 |
| Top 3, low-AI categories (n = 160; 27 top 3) | 4.1 | -4.7 to 12.8 | 0.36 |
| Interaction: top 3 x low-AI | -6.9 | -17.4 to 3.7 | 0.20 |
| Position 1 vs not named | 9.7 | 0.1 to 19.3 | 0.047 |
| Positions 2-3 vs not named | 10.5 | 3.5 to 17.5 | 0.003 |
| Position 4+ vs not named | 3.3 | -1.9 to 8.5 | 0.21 |
| Linear band score (per step) | 4.2 | 1.4 to 7.0 | 0.003 |
| Named (any position) vs not named | 5.1 | -0.1 to 10.2 | 0.053 |
3.4 Robustness
The estimate stayed between 5.6 and 11.1 pp in all checks in Table 5 except the top 3 versus position 4+ comparison at a 5-cell minimum (3.9). Three results stand out.
First, the 74 brands added from the answers do not explain it. Using only the 344 brands from the earlier sample gave 7.4.
Second, cut-short answers do not explain it. Rebuilding the bands without them moved 10 brands across the top-3 line and gave 9.7, and a rule-based extractor that reads every answer in full gave 10.4.
Third, the estimate is less stable when rarely named brands are dropped. When brands named in fewer than 5 cells are removed, top-3 brands still grew 5.6 pp faster than all others, but only 3.9 pp faster than position 4+ brands, with an interval that includes zero. At 10 or more cells, the two estimates are 8.6 and 6.7.
The gap is not confined to one period. In Ads, top-3 brands grew 11.1 pp per year faster in the first half of the post-ChatGPT period (October 2022 to October 2024) and 7.4 pp faster in the second (November 2024 to September 2026), both with intervals above zero. In Trends the halves gave 8.3 and 6.0; the second-half interval includes zero (-1.1 to 13.0), but both halves pass the split-half rule used in Grainger (2026), same sign and one-sided p below 0.10 in each. Nor is the gap produced by the Trends uplift from June 2025: excluding June 2025 onwards gave 9.6 in Ads and 9.1 in Trends, and a level shift from June 2025 gave 9.6 and 8.7.
No single category, brand or parent company accounts for the gap. Leaving out each category in turn gave 7.0 to 9.6; leaving out each brand in turn gave 7.6 to 8.9; dropping the 10 most influential brands gave 6.9; and clustering standard errors by parent company (409 parents) left the interval at 3.5 to 13.0.
Bands built from ChatGPT alone gave 5.6 in Ads (95% CI -0.7 to 12.0) and 10.4 in Trends.
Table 5. Robustness of the top-3 coefficient. Ads unless noted, pp of annual growth, HC3 unless noted.
| Check | n (top 3) | Estimate | 95% CI | p |
|---|---|---|---|---|
| Earlier-sample brands only | 344 (42) | 7.4 | 2.8 to 12.0 | 0.002 |
| Bands rebuilt without cut-short answers | 418 (74) | 9.7 | 5.0 to 14.4 | <0.001 |
| Named brands with at least 5 cells (unnamed kept) | 313 (46) | 5.6 | 0.7 to 10.6 | 0.027 |
| Named only, at least 5 cells: top 3 vs position 4+ | 185 (46) | 3.9 | -0.9 to 8.7 | 0.11 |
| Named brands with at least 10 cells (unnamed kept) | 265 (38) | 8.6 | 3.5 to 13.7 | 0.001 |
| Named only, at least 10 cells: top 3 vs position 4+ | 137 (38) | 6.7 | 2.0 to 11.3 | 0.005 |
| Drop the top-3 Sonic copy instead | 418 (67) | 7.4 | 2.6 to 12.1 | 0.003 |
| Winsorised at 1% and 99% | 418 (68) | 8.2 | 3.4 to 13.0 | <0.001 |
| Trimmed at 1% and 99% | 408 (67) | 7.1 | 2.5 to 11.7 | 0.002 |
| Starting volume at least 1,000 | 405 (63) | 8.0 | 3.2 to 12.7 | 0.001 |
| Starting volume at least 10,000 | 353 (58) | 7.6 | 2.7 to 12.6 | 0.003 |
| Median (quantile) regression | 418 (68) | 7.0 | 3.2 to 10.8 | <0.001 |
| Rule-based extractor, Ads (pre-specified estimator) | 419 (58) | 10.4 | 4.5 to 16.4 | 0.005 |
| Rule-based extractor, Trends (pre-specified estimator) | 374 (43) | 9.9 | 1.2 to 18.5 | 0.026 |
| Parent-brand roll-up (pre-specified estimator) | 419 (66) | 7.7 | 3.2 to 12.3 | 0.009 |
| ChatGPT-only bands, Ads (pre-specified estimator) | 419 (57) | 5.6 | -0.7 to 12.0 | 0.080 |
| ChatGPT-only bands, Trends (pre-specified estimator) | 374 (52) | 10.4 | 2.6 to 18.3 | 0.004 |
| Ads, first half (Oct 2022 to Oct 2024) | 418 (68) | 11.1 | 2.5 to 19.8 | 0.012 |
| Ads, second half (Nov 2024 to Sep 2026) | 418 (68) | 7.4 | 1.2 to 13.7 | 0.020 |
| Trends, first half (to Oct 2024) | 371 (54) | 8.3 | 0.2 to 16.4 | 0.045 |
| Trends, second half (from Nov 2024) | 371 (54) | 6.0 | -1.1 to 13.0 | 0.100 |
| Ads, June 2025 onwards excluded | 418 (68) | 9.6 | 3.4 to 15.8 | 0.003 |
| Ads, level shift from June 2025 | 418 (68) | 9.6 | 3.7 to 15.4 | 0.001 |
| Trends, June 2025 onwards excluded | 371 (54) | 9.1 | 1.8 to 16.4 | 0.015 |
| Trends, level shift from June 2025 | 371 (54) | 8.7 | 1.8 to 15.7 | 0.014 |
| Leave one category out (range of 14) | 380-394 (60-66) | 7.0 to 9.6 | all <0.01 | |
| 10 most influential brands dropped | 408 (58) | 6.9 | 3.2 to 10.6 | <0.001 |
| Standard errors clustered by parent company | 418 (68) | 8.2 | 3.5 to 13.0 | 0.001 |
Note. Cut-short answers: 1,275 (15.6%) according to the collection log, or 1,284 (15.7%) on our recount with the extractor’s chunking rule; the rebuild excludes the 1,284. The difference of 9 is unresolved. The Ads first half includes October and November 2022, before ChatGPT’s launch; starting it in December 2022 gives 12.6 (3.3 to 21.8). For the Trends halves, the segmented model was refitted with only that half’s post-launch months. p-values are two-sided.
3.5 Exploratory, post hoc: start versus end, regression to the mean, and volume by band
Start versus end. Adjusted for size, top-3 brands started about 48 log points below brands of similar measured size in 2022-23 (about 38% lower volume); by 2025-26 the gap (-20) could not be distinguished from zero (Table 6, panel A). This start gap depends on the 2026 controls: it was borderline with a web-mentions control (p = 0.051), not significant with domain rank only (p = 0.083) and absent with category controls only (p = 0.50). The change between start and end (+28 log points over three years) is the growth result in another form, so it barely moves between control sets. The median ratio of end to start volume was 1.157 for top-3 brands and 0.995 for others.
Regression to the mean. Top-3 brands grew 7.6 to 8.7 pp per year faster than brands with the same starting volume, however starting volume was controlled (Table 6, panel B). The top-3 x starting-volume interaction was close to zero (-0.47 pp per log unit; 95% CI -2.82 to 2.14), with no sign that the gap depends on starting size. In the matched comparison, 53 of the 68 top-3 brands found a same-category partner with nearly the same starting volume; their mean growth gap was 8.7 pp. Growth was unrelated to starting volume overall (Spearman 0.035), and flexible controls or matching changed the estimate little, so the gap does not reflect brand size. These checks cannot rule out top-3 brands recovering from a temporarily low start.
Table 6. Exploratory, post hoc. Panel A: top 3 vs other, ln Ads volume x 100 (log points), n = 413, category fixed effects, wild cluster bootstrap. Panel B: top-3 coefficient on Ads growth (pp per year), n = 418, category fixed effects, wild cluster bootstrap.
| Panel and model | Estimate | 95% CI | p |
|---|---|---|---|
| A. Start level (Oct 2022-Sep 2023), size controls | -48.3 | -92.0 to -4.0 | 0.036 |
| A. End level (Oct 2025-Sep 2026), size controls | -20.1 | -66.2 to 26.0 | 0.377 |
| A. Change (end - start), size controls | +28.2 | 12.7 to 42.0 | 0.003 |
| A. Start level, size + web mentions | -40.6 | -78.5 to 0.3 | 0.051 |
| A. End level, size + web mentions | -11.9 | -53.1 to 31.2 | 0.541 |
| A. Change, size + web mentions | +28.7 | 13.3 to 43.3 | 0.001 |
| A. Start level, domain rank only | -44.0 | -93.2 to 6.7 | 0.083 |
| A. End level, domain rank only | -15.3 | -66.0 to 35.7 | 0.537 |
| A. Change, domain rank only | +28.7 | 13.5 to 42.4 | 0.001 |
| A. Start level, category only | -25.9 | -104.5 to 50.5 | 0.503 |
| A. End level, category only | +2.1 | -75.0 to 76.6 | 0.953 |
| A. Change, category only | +28.0 | 12.7 to 42.1 | 0.003 |
| B. Headline model: ln starting volume | 8.24 | 3.62 to 12.79 | 0.002 |
| B. Starting-volume deciles | 8.44 | 3.65 to 13.32 | 0.003 |
| B. Cubic spline of ln starting volume (5 df) | 7.59 | 2.60 to 12.59 | 0.008 |
| B. Top 3, with interaction (at mean ln starting volume) | 8.19 | 3.62 to 12.88 | 0.003 |
| B. Interaction: top 3 x ln starting volume | -0.47 | -2.82 to 2.14 | 0.67 |
| B. Matched pairs (53 of 68 top-3 brands matched) | 8.67 | 3.32 to 15.27 | 0.004 |
Note. Panel A size controls (domain rank, listing, parent company, shared parent domain) and web mentions were measured in 2026, at the end of the window. If faster growth raised them, adjusting for them makes top-3 brands look smaller at the start than they were; the domain-rank-only and category-only rows reduce this risk, and the change rows do not depend on the controls. The headline interval differs slightly from Table 3 (HC3).
Volume by band. Figure 3 shows the growth gap month by month. By September 2026, the geometric-mean index (October 2022 = 100) was 129.7 for position-1 brands (95% CI 102.4 to 168.9) and 146.9 for positions 2-3 (120.4 to 183.2), against 106.9 for position 4+ (97.6 to 117.5) and 102.5 for brands not named (88.6 to 120.5). Among the 290 named brands, a better (lower) mean position was associated with faster growth (Spearman -0.223, p = 0.0001; unadjusted).
3.6 Exploratory, post hoc: case studies
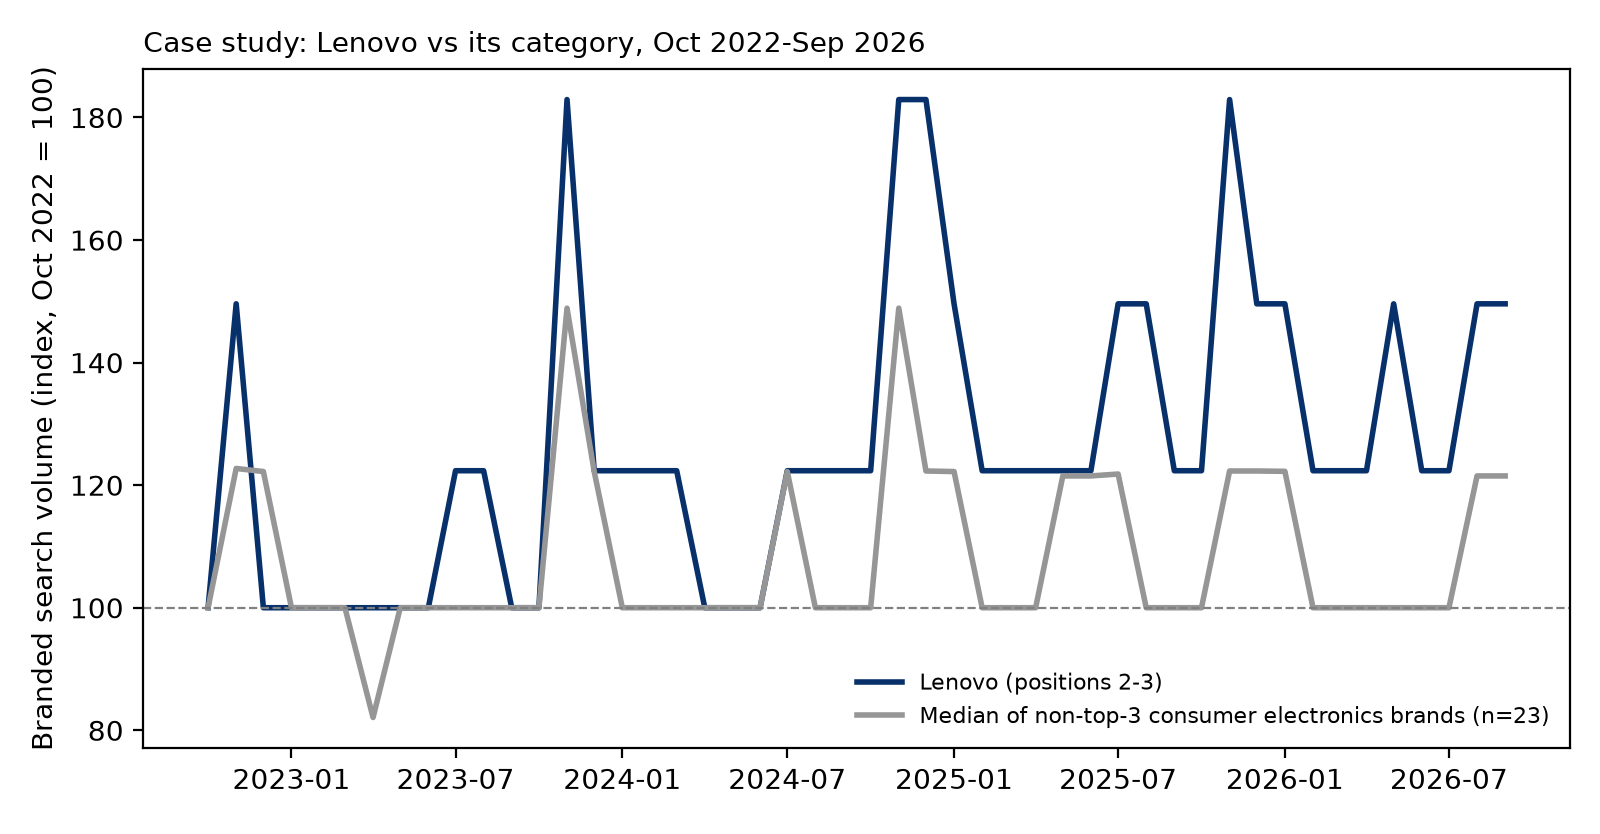
Lenovo (rule-based). The rule chose Lenovo (Consumer electronics), whose growth gap over its category (+7.12 pp per year) was closest to the median gap across top-3 brands (+7.10). McDonald’s (+7.08) was exactly as close; the alphabetical tie-break fixed in the rule chose Lenovo. Lenovo sits at positions 2-3, named in 60 cells by all five AI engines, with a mean position of 3.3. Its index reached 149.6 in September 2026, against 121.5 for the median of 23 non-top-3 consumer electronics brands; over the last 12 months it averaged 138.8 against 109.2 (Figure 4).
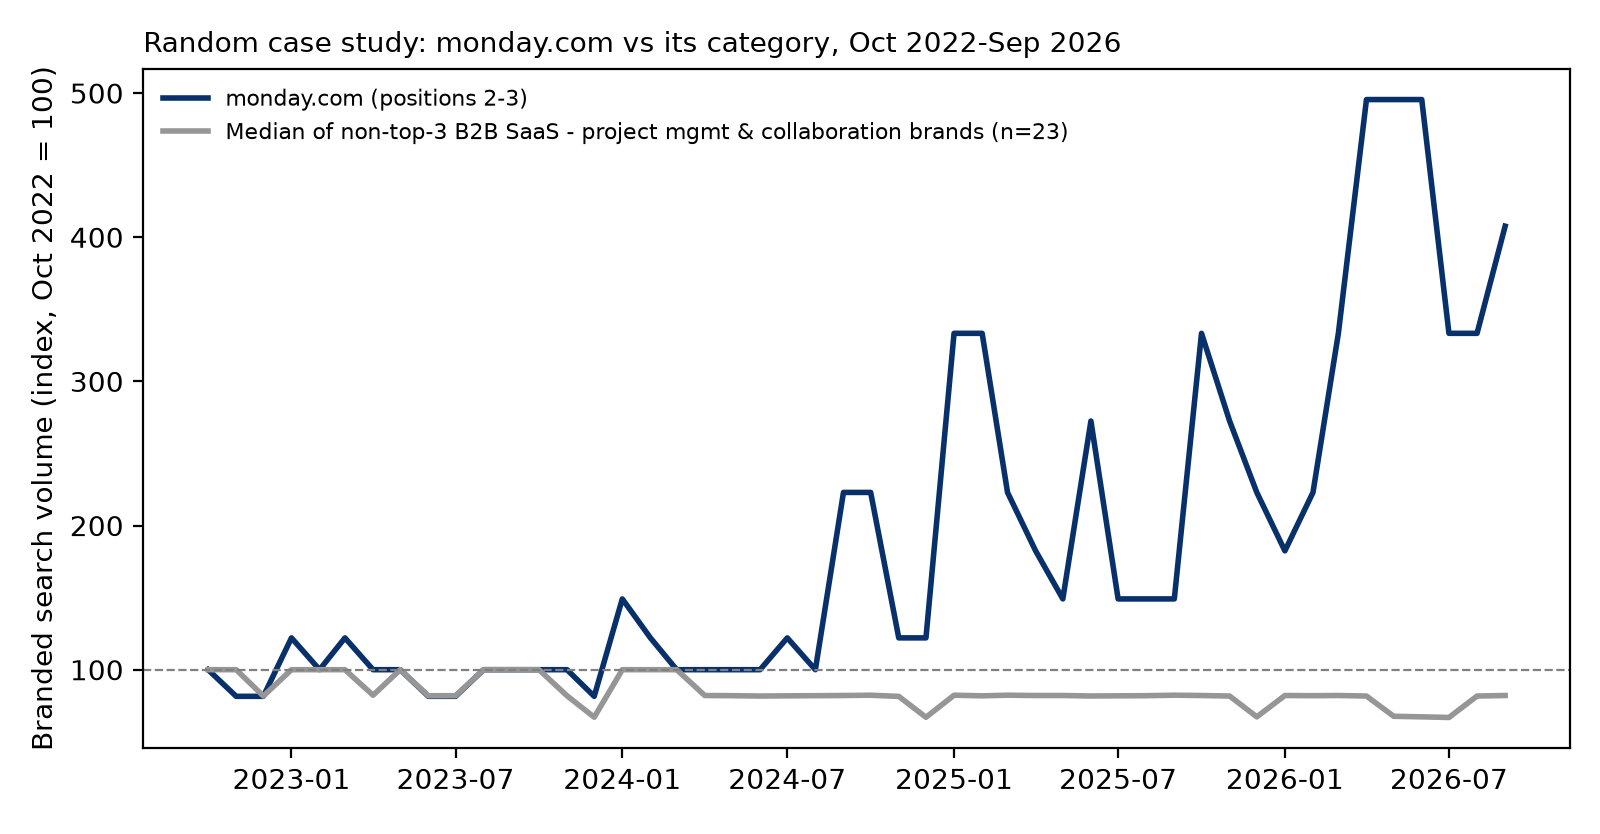
monday.com (random draw 1). monday.com (project management and collaboration software; positions 2-3; 77 cells; mean position 2.5; all five AI engines) grew 41.8 pp per year against a category median of -2.9. Its index reached 407.7 in September 2026, against 82.1 for its category; the last-12-month averages were 344.0 and 77.1 (Figure 5).
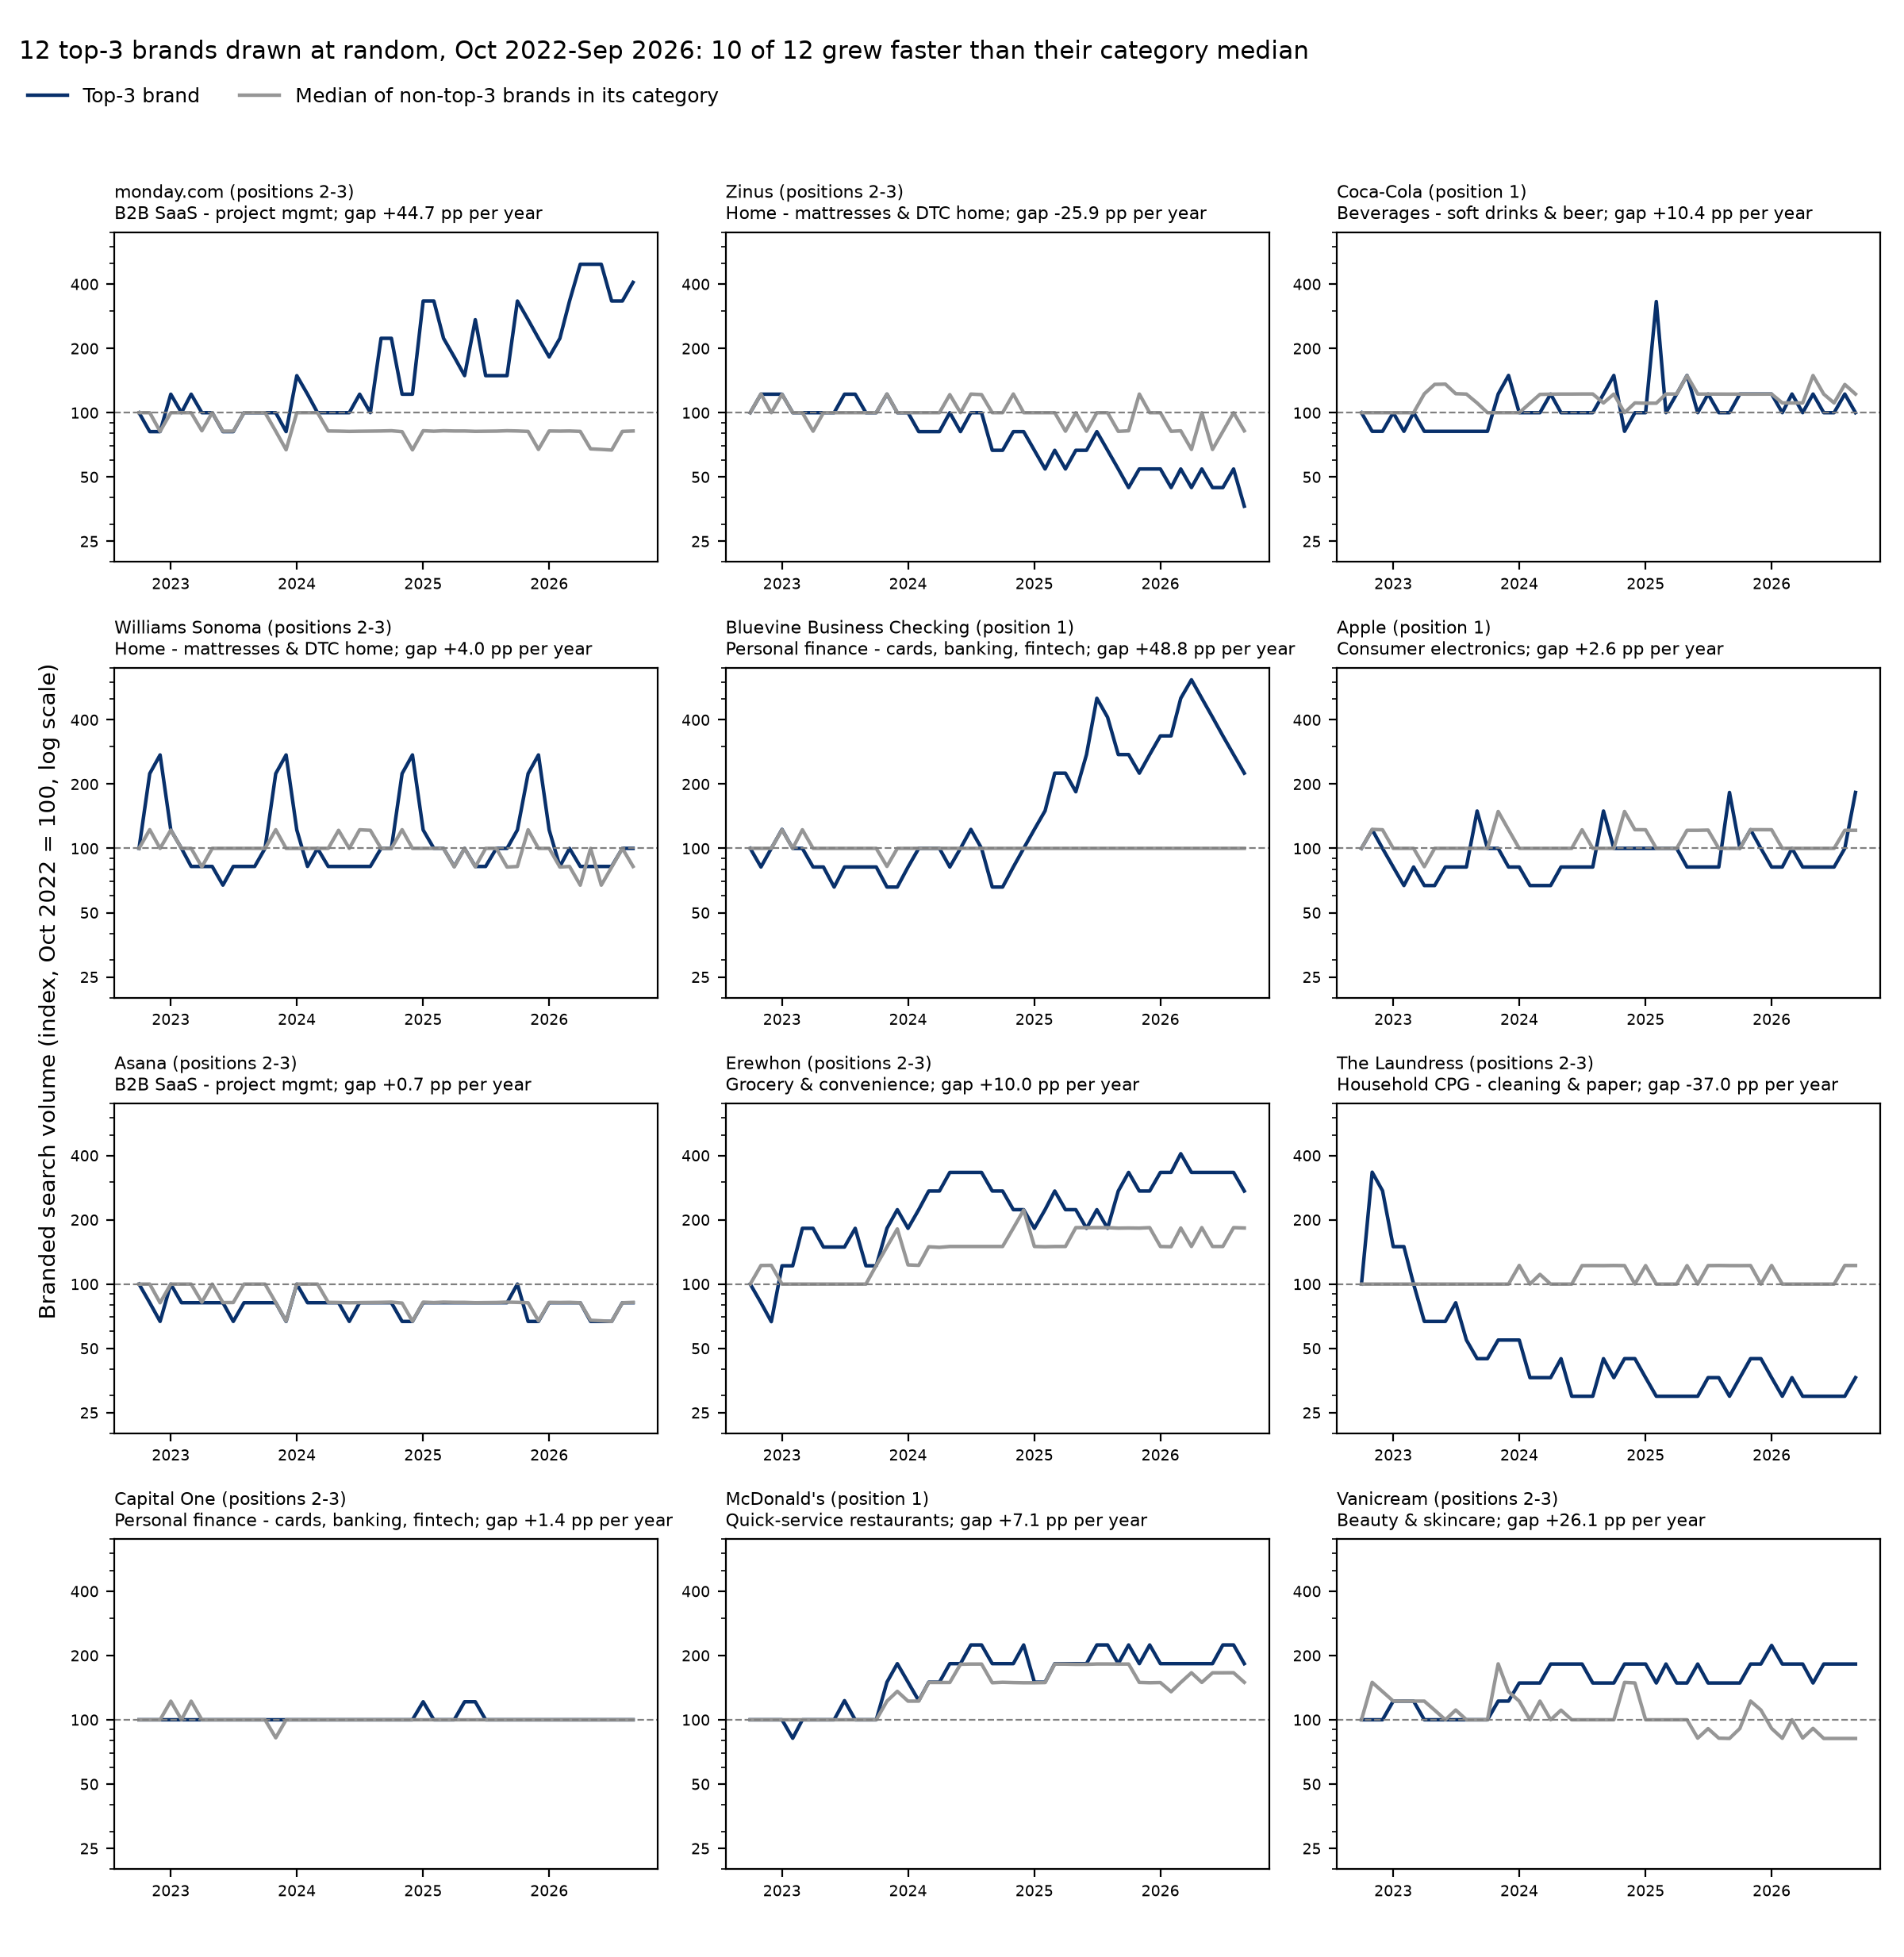
Twelve random draws. Across all 12 randomly drawn top-3 brands (two in draw 1, ten in draw 2), 10 grew faster than their category median (by definition, about 6 of 12 non-top-3 brands would), and the median gap was +5.5 pp per year (Table 7; Figure 6). Gaps ranged from -37.0 to +48.8. Two brands had negative gaps: Zinus was flat through 2023 and then declined (-25.9), and The Laundress spiked in late 2022, fell sharply through 2023, kept falling to mid-2024 and was flat after that (-37.0). On last-12-month averages, 7 of the 12 were above their category (Asana by 0.03), and Capital One was level.
Some cases rest on thin AI evidence. Williams Sonoma and Bluevine Business Checking were each named in only 1 cell, and The Laundress in 2, so their band could change with a different sample of answers. For Coca-Cola and Apple the last-12-month index is below the category although the growth gap is positive: the gap compares growth over all 48 months with the median category growth rate, while the index compares levels with the median category index.
Table 7. Twelve top-3 brands drawn at random. Gap in pp per year: brand growth minus median growth of non-top-3 brands in its category. Index: Ads volume, October 2022 = 100. Summary: 10 of 12 brands have a positive gap (median gap +5.5); 7 of 12 have a last-12-month index above their category. Williams Sonoma was initially miscategorised as household cleaning and is compared here with the home category.
| Brand | Band | Cells | Mean pos. | AI engines | Gap | Last-12-month index, brand vs category |
|---|---|---|---|---|---|---|
| monday.com | 2-3 | 77 | 2.5 | All 5 | +44.7 | 344.0 vs 77.1 |
| Zinus | 2-3 | 7 | 3.1 | All 5 | -25.9 | 48.9 vs 88.9 |
| Coca-Cola | 1 | 56 | 1.2 | All 5 | +10.4 | 113.0 vs 121.9 |
| Williams Sonoma | 2-3 | 1 | 3.0 | Gemini | +4.0 | 121.1 vs 88.9 |
| Bluevine Business Checking | 1 | 1 | 1.0 | Perplexity | +48.8 | 360.0 vs 100.0 |
| Apple | 1 | 85 | 1.1 | All 5 | +2.6 | 99.7 vs 109.2 |
| Asana | 2-3 | 83 | 2.1 | All 5 | +0.7 | 77.08 vs 77.05 |
| Erewhon | 2-3 | 4 | 2.2 | 4 (not AI Overviews) | +10.0 | 324.4 vs 169.4 |
| The Laundress | 2-3 | 2 | 1.2 | ChatGPT, Gemini | -37.0 | 34.5 vs 109.2 |
| Capital One | 2-3 | 61 | 3.0 | All 5 | +1.4 | 100.0 vs 100.0 |
| McDonald’s | 1 | 48 | 2.8 | All 5 | +7.1 | 196.8 vs 156.5 |
| Vanicream | 2-3 | 17 | 2.9 | All 5 | +26.1 | 180.2 vs 91.5 |
4. Discussion
4.1 Principal findings
Brands that AI engines place in the top three of their recommendations have grown about 8 pp per year faster in branded search since late 2022 than comparable brands. The gap appears in both Google Ads and Google Trends, in both halves of the post-ChatGPT period, survives a control for each brand’s earlier trend, and was not detected from 2015 to 2022.
In post hoc checks, the gap was similar against brands of the same starting volume. Individual brands vary widely: in 12 random draws, 10 grew faster than their category, and some declined.
4.2 Relation to our earlier study
This study’s estimate (8.2) agrees with the earlier one (7.1; Section 1.4). Because the two share most brands and the same outcome data, this suggests the result is not specific to one way of measuring position, not that it has been independently replicated. Two things differ. The pre-ChatGPT placebos here (-0.7 for the ordering, -1.6 for the top three) point the same way as the earlier reversal but are smaller and not significant. And the gap now appears in both halves of the post-launch period, so it passes the earlier study’s split-half rule (Section 3.4).
4.3 The “already winning” explanation
Positions were measured in October 2026, after the growth they are compared with. AI engines draw on what is written about brands online, and brands that have grown attract more coverage, so a brand may be recommended because it grew rather than grow because it was recommended. The flat 2015-2022 placebo and the control for each brand’s earlier trend (7.0 in Ads) suggest that top-3 brands were not simply on a faster path before ChatGPT, though recovery from a low start cannot be ruled out (Section 3.5). They cannot show which came first after 2022.
The start-versus-end result fits both readings: brands that caught up with their size peers may have been recommended more as they grew, or grown more as they were recommended.
4.4 Is position itself linked to growth?
The point estimates look more like a step than a gradient (Section 3.3). Brands at position 1 and positions 2-3 grew at similar rates, and both grew faster than brands named lower or not named. With 18 position-1 brands, the study cannot rule out a modest advantage for first place. Part of the top-3 gap is also a gap between brands that engines name and brands they do not: among well-measured brands, the top-3 versus position 4+ gap was smaller and less certain (Section 3.4).
4.5 Relation to the panel studies
Panel studies find that people who receive an AI recommendation are more likely to search for or visit the brand within a week (Iannelli, 2026; Kehoe, 2026). Our data measure something different: whether brands that engines rank highly show faster branded search growth across the US over four years. The gap was larger in the AI-relevant categories than in the low-AI ones (10.9 versus 4.1 pp), which is what the branding account predicts, but the difference between category groups is not significant. These results are compatible with an aggregate echo of the individual-level pattern, and also with AI engines favouring brands that were already gaining attention.
4.6 Timing of the gap
Figure 1 sets the two groups against the AI engine releases in Table 1. In Google Trends (panel a), each line is measured against its own 2015-2022 average, so both average zero before the launch by construction; the relevant test is the trend, and before the launch top-3 brands grew no faster than the others (-1.6 pp per year; Table 3). The lines separate after the launch: by September 2026, top-3 brands stood 37 points above their own 2015-2022 average, against 20 for other brands. The rise in both lines from mid-2025 is the broad Trends uplift noted in Grainger (2026), which appeared across all types of term in that study. In Google Ads (panel b), the two groups moved together through most of 2023. The gap opened mainly between December 2023 and February 2024, about a year after ChatGPT’s launch, and persisted; it widened again in 2026 as other brands’ volume fell back. By September 2026 the geometric-mean index was 142 for top-3 brands and 105 for other brands (October 2022 = 100).
This timing is consistent with the spread of AI engines, but it does not show that adoption caused the growth: many other things changed over the same years.
4.7 Limitations
- Exploratory comparison. The top-3 comparison was chosen after this study’s results, and the earlier paper’s results for 344 of the same brands, had been seen. p-values in Sections 3.2 to 3.6 are descriptive.
- Timing and retrospective design. Positions were measured after the growth window, so the order of events is unknown (Section 1.5).
- Extraction. Against 100 answers hand-coded by the author, top-1 accuracy was 95.0% (95% CI 88.7 to 98.4) and band agreement (kappa) was 0.7997, just below the planned 0.80; AI Overviews and AI Mode were weakest. The planned double human coding of 818 answers was replaced by one human coder on 100 answers and an AI coder on 169.
- Snapshot. One country, one two-day window, five engines, with model versions as reported by DataForSEO.
- Measurement. Google Ads volumes are rounded and can merge close variants. Entity resolution produced at least one duplicate (Sonic), and others may exist.
- Post hoc controls measured at the end. The size and web-mentions controls in Section 3.5 were measured in 2026 and may partly reflect growth.
- Case studies. Thirteen brands illustrate the range of outcomes; they are not a test.
4.8 Future research
- Measure position first. A 12-month prospective study will fix its hypothesis and analysis in advance and will be preregistered publicly. It will measure positions monthly from 26 October 2026 and track branded search from November 2026, so that position is observed before the outcome.
- Repeat the measurement over time. Measuring positions at fixed intervals would allow within-brand tests: whether a brand that moves into the top three then gains branded search, with brand fixed effects absorbing size and maturity.
- Separate “named” from “ranked”. Designs that compare brands named in similar numbers of answers would show whether rank adds anything beyond being named.
5. Conclusions
Brands that AI engines place in the top three have grown about 8 pp per year faster in branded search since late 2022 than comparable brands, on two data sources and in both halves of the period, with no detectable gap before ChatGPT. The comparison was chosen after the data were seen and positions were measured after the growth, so this is an association, not evidence that AI ranking causes search growth. A preregistered prospective study will test the order of events.
Declarations
Funding. No external funding. The work was carried out by Ranking Atlas.
Competing interests. Daniel Grainger founded and owns Ranking Atlas, an AI SEO agency that sells services intended to improve how brands appear in AI engine answers. Findings that link AI recommendation position to search growth could be commercially useful to Ranking Atlas. To limit this conflict, the pre-specified tests are reported in full, including those not supported, and the exploratory status of the main comparison is stated throughout. No client or third party funded, reviewed or approved this work.
Analysis plan. See Section 2.1. The plan was frozen privately and not deposited with a public registry; the files are available from the author on request. The post hoc case-study rules (Section 2.7) were frozen and hashed before the brands they chose were known.
Data availability. Data available from the author on request.
Author contributions. Daniel Grainger is the sole author and was responsible for the conceptualisation, methodology, analysis, writing and final approval of the paper.
Use of AI tools. The author designed the study. Grokbot, an AI agent made by xAI, collected the data through DataForSEO and ran the analysis. Brands and positions were extracted from answers by gpt-4.1-mini (OpenAI). Claude (Anthropic) was used to check the paper’s figures and references against their sources and to edit the text. ChatGPT, Gemini, Google AI Mode, Google AI Overviews and Perplexity were the objects of study. The author reviewed all outputs and takes full responsibility for the content.
Ethics. This study used AI engine answers to brand-free prompts and aggregate search data only. No human participants or personal data were involved.
References
Bick, A., Blandin, A., & Deming, D. J. (2024). The rapid adoption of generative AI (NBER Working Paper No. 32966; revised February 2025). National Bureau of Economic Research. https://doi.org/10.3386/w32966
Chatterji, A., Cunningham, T., Deming, D. J., Hitzig, Z., Ong, C., Shan, C. Y., & Wadman, K. (2025). How people use ChatGPT (NBER Working Paper No. 34255). National Bureau of Economic Research. https://doi.org/10.3386/w34255
Craswell, N., Zoeter, O., Taylor, M., & Ramsey, B. (2008). An experimental comparison of click position-bias models. In Proceedings of the 2008 International Conference on Web Search and Data Mining (pp. 87-94). ACM. https://doi.org/10.1145/1341531.1341545
DataForSEO. (n.d.). Google Ads search volume (live) [API documentation]. https://docs.dataforseo.com/v3/keywords_data-google_ads-search_volume-live/. Retrieved October 25, 2026.
Goodwin, D. (2024). Rand Fishkin on the SEO opportunity pie shrinking and more insights. Search Engine Land. https://searchengineland.com/seo-opportunity-shrinking-rand-fishkin-448876. Retrieved October 24, 2026.
Grainger, D. (2026, October 24). Is AI engine exposure associated with rising branded search? A two-source study of 347 US brands, 2015-2026, with a pre-specified analysis plan. Ranking Atlas Working Paper RA-WP-2026-02. Zenodo. https://doi.org/10.5281/zenodo.23636267
Hsiao, S. (2024, February 8). Bard becomes Gemini: Try Ultra 1.0 and a new mobile app today. Google. https://blog.google/products-and-platforms/products/gemini/bard-gemini-advanced-app/. Retrieved October 25, 2026.
Hsiao, S., & Collins, E. (2023, March 21). Try Bard and share your feedback. Google. https://blog.google/innovation-and-ai/products/try-bard/. Retrieved October 25, 2026.
Hu, K. (2023, February 1). ChatGPT sets record for fastest-growing user base - analyst note. Reuters. https://www.reuters.com/technology/chatgpt-sets-record-fastest-growing-user-base-analyst-note-2023-02-01/. Retrieved October 25, 2026.
Iannelli, M. (2026, June 17). The prompt-to-purchase pipeline: What millions of search events told us about how AI influences buyer behavior. Scrunch. https://scrunch.com/blog/prompt-to-purchase-pipeline-how-ai-influences-buyer-behavior/. Retrieved October 24, 2026.
Indig, K. (2026a, July 20). Does topical authority matter in AI search? Growth Memo. https://www.growth-memo.com/p/does-topical-authority-matter-in. Retrieved October 24, 2026.
Indig, K. (2026b, October 19). Does AI drive more direct traffic? Growth Memo. https://www.growth-memo.com/p/does-ai-drive-more-direct-traffic. Retrieved October 24, 2026.
Joachims, T., Granka, L., Pan, B., Hembrooke, H., & Gay, G. (2005). Accurately interpreting clickthrough data as implicit feedback. In Proceedings of the 28th Annual International ACM SIGIR Conference on Research and Development in Information Retrieval (pp. 154-161). ACM. https://doi.org/10.1145/1076034.1076063
Kehoe, A. (2026, June 23). Being recommended in AI makes users 2.5x more likely to visit your site. Similarweb. https://aisearch.similarweb.com/blog/ai-visibility-downstream-impact/. Retrieved October 24, 2026.
Narayanan, S., & Kalyanam, K. (2015). Position effects in search advertising and their moderators: A regression discontinuity approach. Marketing Science, 34(3), 388-407. https://doi.org/10.1287/mksc.2014.0893
OpenAI. (2022, November 30). Introducing ChatGPT. https://openai.com/index/chatgpt/. Retrieved October 25, 2026.
OpenAI. (2023, March 14). GPT-4. https://openai.com/index/gpt-4-research/. Retrieved October 25, 2026.
OpenAI. (2024, October 31). Introducing ChatGPT search. https://openai.com/index/introducing-chatgpt-search/. Retrieved October 25, 2026.
Pew Research Center. (n.d.). Majorities of adults under 50 now use ChatGPT [Chart]. https://www.pewresearch.org/chart/majorities-of-adults-under-50-now-use-chatgpt/. Retrieved October 25, 2026.
Pew Research Center. (2023, August 28). Most Americans haven’t used ChatGPT; few think it will have a major impact on their job. https://www.pewresearch.org/short-reads/2023/08/28/most-americans-havent-used-chatgpt-few-think-it-will-have-a-major-impact-on-their-job/. Retrieved October 25, 2026.
Pew Research Center. (2025, June 25). 34% of U.S. adults have used ChatGPT, about double the share in 2023. https://www.pewresearch.org/short-reads/2025/06/25/34-of-us-adults-have-used-chatgpt-about-double-the-share-in-2023/. Retrieved October 25, 2026.
Pichai, S. (2025, May 20). Google I/O 2025: From research to reality. Google. https://blog.google/innovation-and-ai/technology/ai/io-2025-keynote/. Retrieved October 25, 2026.
Reid, E. (2024, May 14). Generative AI in Search: Let Google do the searching for you. Google. https://blog.google/products-and-platforms/products/search/generative-ai-google-search-may-2024/. Retrieved October 25, 2026.
Reid, E. (2025, May 20). AI in Search: Going beyond information to intelligence. Google. https://blog.google/products-and-platforms/products/search/google-search-ai-mode-update/. Retrieved October 25, 2026.
Seer Interactive. (2026, July 16). The Signal - July 2026: AI AMA with Wil Reynolds and Alisa Scharf [Webinar recap]. https://www.seerinteractive.com/events/event-recap-the-signal-july-2026. Retrieved October 24, 2026.
Silva, C. (2026, May 20). How to measure and report on AI search visibility (what actually matters). Semrush. https://www.semrush.com/blog/measure-ai-visibility/. Retrieved October 24, 2026.
Srinivas, A. (2022, December 7). Show HN: Web search powered by GPT and Bing. Hacker News. https://news.ycombinator.com/item?id=33897884. Retrieved October 25, 2026.
Ursu, R. M. (2018). The power of rankings: Quantifying the effect of rankings on online consumer search and purchase decisions. Marketing Science, 37(4), 530-552. https://doi.org/10.1287/mksc.2017.1072
Wiggers, K. (2023, April 4). AI-powered search engine Perplexity AI lands $26M, launches iOS app. TechCrunch. https://techcrunch.com/2023/04/04/ai-powered-search-engine-perplexity-ai-lands-26m-launches-ios-app/. Retrieved October 25, 2026.
Cite this paper
Grainger, D. P. (2026). Brands ranked in the top three positions by AI engines in October 2026 had faster branded search growth from ChatGPT's launch in 2022 than brands outside the top three positions: exploratory evidence from 418 US brands. Zenodo. https://doi.org/10.5281/zenodo.23636562
The text of this paper is licensed under Creative Commons Attribution 4.0 International (CC BY 4.0).
Not peer reviewed.