The property data Andy Burnham doesn't want to see
Homes near cancelled HS2 stations have outperformed England's average by up to 9 percentage points since Sunak axed the line. Areas near active HS2 construction have fallen sharply.
Content Written By:
Ranking Atlas
Published June 2026
7 min read
Key takeaways
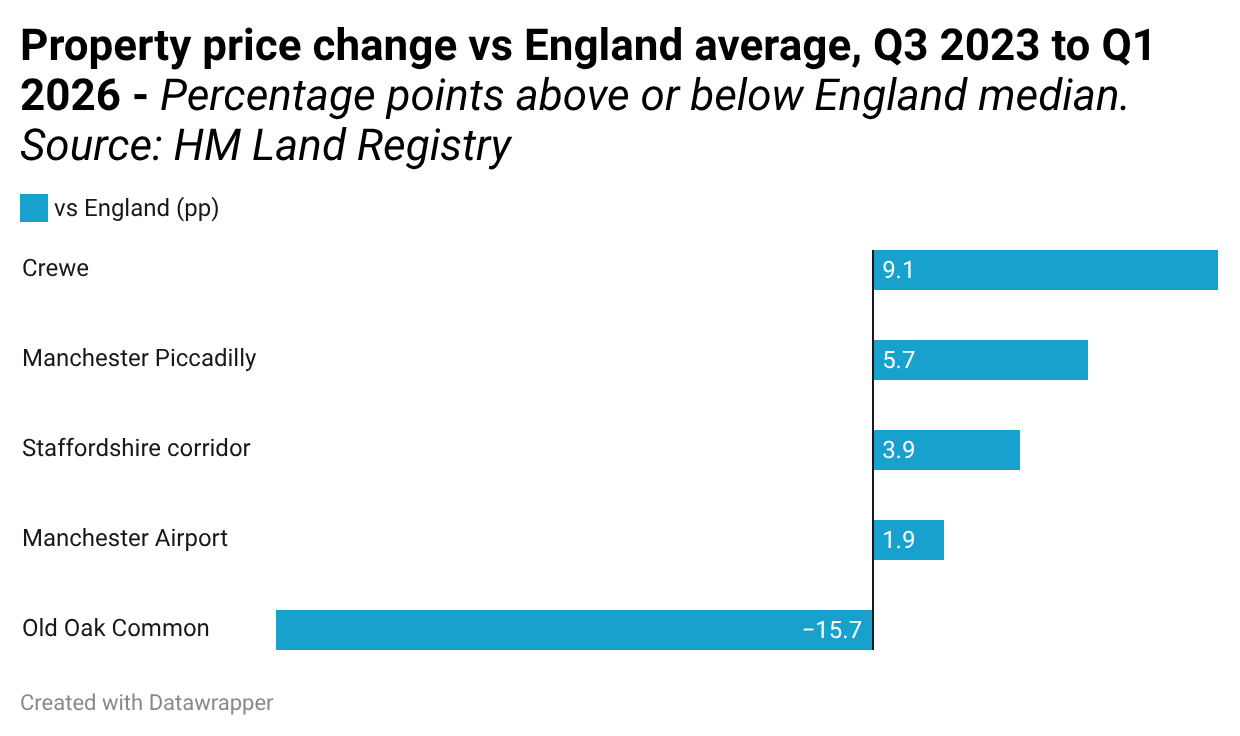
- Every cancelled HS2 area outperformed England. England's median property price fell 3.5% between Q3 2023 and Q1 2026. Homes near all four major cancelled northern stations rose or held flat in absolute terms.
- Crewe outperformed England by 9.1 percentage points. The town slated to become the northern HS2 hub recorded a 5.6% median price rise. England fell 3.5% over the same period.
- Manchester Piccadilly-adjacent properties beat England by 5.7 percentage points, rising 2.1% in a national market that declined.
- Old Oak Common fell nearly a fifth. Median prices near the active London HS2 super-hub dropped 19.2%, underperforming England by 15.7 percentage points. Construction blight is visible in the data.
- The feared reverse-announcement effect did not materialise. HS2 cancellation was widely predicted to strip value from Northern towns. Land Registry transaction data does not support that prediction.
- More than 600,000 transactions underpin the analysis. Data is drawn from HM Land Registry Price Paid Data, covering Q3 2023 through Q1 2026 across every postcode district adjacent to a major planned or active HS2 station.
Andy Burnham said last week he would reinstate HS2's northern leg between Birmingham and Manchester if he became Prime Minister. His pitch to Northern homeowners: cancellation has cost them money, and reinstatement would give it back.
The property data tells a more complicated story.
Ranking Atlas analysed more than 600,000 residential property transactions recorded by HM Land Registry between Q3 2023, the last full quarter before Rishi Sunak cancelled the northern leg on 4 October 2023, and Q1 2026. We filtered the data by postcode district for every major planned station on the cancelled route, then compared performance against the England-wide median.
The finding is counterintuitive: every cancelled HS2 area has outperformed the England average. Areas near active HS2 construction have significantly underperformed.
Cancelled HS2 areas outperformed England
England's median property price fell 3.5% over the period, from £285,000 in Q3 2023 to £275,000 in Q1 2026. High interest rates and subdued buyer demand set the backdrop.
Against that national decline, homes near cancelled HS2 stations held firm or rose.
| Area | Q3 2023 median | Q1 2026 median | Change | vs England |
|---|---|---|---|---|
| Crewe (CW1, CW2) | £180,000 | £190,000 | +5.6% | +9.1pp |
| Manchester Piccadilly (M1, M11, M12) | £210,000 | £214,500 | +2.1% | +5.7pp |
| Staffordshire corridor (ST15, ST16, WS13) | £249,076 | £250,000 | +0.4% | +3.9pp |
| Manchester Airport (M22, SK9) | £315,000 | £310,000 | -1.6% | +1.9pp |
| England (national baseline) | £285,000 | £275,000 | -3.5% | baseline |
Crewe was slated to become the northern HS2 hub, the junction where trains would split for Manchester and Leeds. It has been one of the stronger property markets in England over the past two and a half years, rising 5.6% while the national median was falling.
Manchester Piccadilly-adjacent properties rose 2.1% against a 3.5% national decline. The Staffordshire corridor, which sits along the cancelled route between Birmingham and Crewe, held almost flat. Manchester Airport districts slipped slightly in absolute terms but still beat England by 1.9 percentage points.
In every case, the cancellation of HS2 did not produce the property market shock that commentators predicted in October 2023.
Active construction sites tell a different story
We ran the same analysis on postcode districts near HS2 Phase 1 stations still under active construction, sites where building work continues today.
| Area | Q3 2023 median | Q1 2026 median | Change | vs England |
|---|---|---|---|---|
| Old Oak Common, London (NW10, W3) | £517,500 | £418,000 | -19.2% | -15.7pp |
| England (national baseline) | £285,000 | £275,000 | -3.5% | baseline |
Old Oak Common, the London super-hub where HS2 and Elizabeth line trains will interchange, has seen median prices fall nearly a fifth since Q3 2023. It underperforms the England average by 15.7 percentage points.
Construction blight is a well-documented phenomenon in property research. Noise, dust, restricted access, and years-long uncertainty consistently suppress values near major infrastructure sites during the build phase. The data here is consistent with that pattern.
The Old Oak Common result reflects both HS2 construction disruption and the broader softening of London prices over the same period. Both factors are likely in play. The scale of the underperformance, nearly 16 percentage points below the national median, suggests construction blight is a significant contributor.
This finding matters for Burnham's pitch. If reinstatement proceeds, the areas near new construction would experience the same disruption that Old Oak Common is experiencing now. The "HS2 cancelled, prices fell" narrative is not what Land Registry shows. The more accurate pattern is: "HS2 construction active, prices fell."
What this means for Burnham's pitch
Burnham's argument rests on the assumption that cancellation has depressed Northern property values and that reinstatement would reverse the damage. The transaction data does not support the first part of that claim.
Crewe homeowners have not been punished by the markets for losing their HS2 hub. Manchester Piccadilly-adjacent properties are ahead of the national average. The feared reverse-announcement effect, where HS2 cancellation would strip value from Northern towns the way HS2 announcements had once boosted them, has not materialised in the Land Registry data.
That does not mean cancellation was costless. Local authorities lost planned regeneration investment. Businesses relocated from affected zones were not fully compensated. Transport connectivity improvements were real and were lost. But the residential property market has absorbed the cancellation without the collapse that many predicted.
The same pattern of counterintuitive findings from open government datasets appears in other areas of public policy: what the data shows often diverges sharply from political framing on both sides. The HS2 property story is another example.
“The data here is drawn directly from Land Registry, the most authoritative source available for residential property prices. The counterintuitive finding is that the Northern markets most people assumed were hurt by cancellation have actually outperformed England. Whether that is Northern market momentum, a recognition that HS2 construction comes with its own disruption costs, or simply that the cancellation was partially priced in early, the numbers are clear.”
Daniel Grainger, Ranking Atlas
Methodology
Data source
HM Land Registry Price Paid Data, downloaded directly from gov.uk. The dataset is open data, updated monthly, and covers all residential property transactions in England and Wales registered at Land Registry. It is the most comprehensive source of residential transaction prices available for England.
Comparison period
Q3 2023 (July to September 2023) was chosen as the pre-cancellation baseline: the last complete quarter before Rishi Sunak cancelled the northern leg on 4 October 2023. Q1 2026 (January to March 2026) is the most recent complete quarter at the time of analysis. The period captures approximately two and a half years of post-cancellation market data.
Metric
Median residential sale price per postcode district, for each comparison quarter. Median is used rather than mean to reduce sensitivity to outlier transactions at the top of the price distribution.
Transaction volume
229,520 national transactions in the Q3 2023 baseline quarter. 130,091 national transactions in Q1 2026. More than 600,000 transactions across the full analysis window. The lower Q1 2026 volume reflects both seasonal patterns (Q3 is typically the strongest quarter for completions) and continued subdued market activity in 2026.
Postcode selection
Postcode districts were selected by identifying all districts containing or immediately adjacent to planned HS2 station sites, based on published HS2 route documentation and station location data. For cancelled northern stations: CW1 and CW2 (Crewe), M1, M11, and M12 (Manchester Piccadilly), ST15, ST16, and WS13 (Staffordshire corridor), M22 and SK9 (Manchester Airport). For active construction: NW10 and W3 (Old Oak Common).
Exclusions
Transactions below £10,000 were excluded as likely non-arm's-length sales (transfers, gifts, or administrative disposals). No other price-based exclusions were applied. Commercial, agricultural, and non-residential transactions are not included in Land Registry Price Paid Data and are therefore absent from the analysis by default.
Baselines
England national median for each quarter, calculated from the same Price Paid dataset across all postcode districts in England. Percentage point differences ("vs England") are calculated as the area's percentage change minus England's percentage change over the same period. All figures are nominal, not inflation-adjusted. The same principle of grounding analysis in primary-source, reproducible data applies across all Ranking Atlas research.
Limitations
Postcode districts are imprecise proxies. A postcode district like M1 covers a defined geographic area but does not map perfectly to the catchment of a planned station. Properties at the edge of a district may be further from the station than properties in an adjacent district not included in the analysis. The approach is consistent with how similar studies are conducted and is fit for identifying broad market-level trends, but it cannot capture hyper-local variation within a district.
Old Oak Common conflates two effects. The NW10 and W3 districts have experienced both active HS2 construction disruption and the broader softening of inner-west London prices since 2023. The relative contribution of each cannot be disaggregated from transaction data alone. The -19.2% figure should be read as reflecting both factors.
Correlation is not causation. The analysis establishes that cancelled HS2 areas outperformed England after cancellation. It does not establish that cancellation caused that outperformance. Other factors, including Northern market momentum, lower starting valuations, interest-rate sensitivity by price tier, and local economic conditions, may have contributed.
Two and a half years may be insufficient to capture announcement effects. Some property economists argue that major infrastructure decisions take five to ten years to fully price in. The period analysed here covers the immediate post-cancellation window but may not capture longer-run adjustment.
Figures are nominal. Price changes are reported in nominal terms and have not been adjusted for inflation. UK CPI rose approximately 8% between Q3 2023 and Q1 2026. Real price changes are therefore lower than the nominal figures shown. The comparison against the England national median is unaffected by this, as both series are nominal.
Download the data
The underlying price data by postcode district and quarter, including transaction counts and median prices for every area in the analysis.
hs2-property-prices.csv
Postcode district, Q3 2023 median, Q1 2026 median, % change, pp vs England, transaction counts.
Citation: Ranking Atlas, "The property data Andy Burnham doesn't want to see," June 2026. Source data: HM Land Registry Price Paid Data (open government licence).
For a different cut of this dataset, additional regional or postcode-level breakouts, or methodology questions, contact contact@ranking-atlas.com.
Related Research
Who Actually Gets Scammed in America?
Federal fraud and survey data show sharp divides in who gets scammed, how often, and how much they lose. Another counterintuitive finding from open government data.
The Hidden Economy Behind Google Rankings
A six-year analysis of 140,000 publisher listings reveals how paid link markets expanded after repeated Google crackdowns.
Welcome to the SaaSpocalypse
Software that can be vibe-coded by a small team has lost all pricing power, while AI-resistant SaaS categories raised entry-tier prices up to three times faster than inflation.
Ranking Atlas is a specialist data campaigns firm. We turn proprietary data, commissioned research, and original analysis into stories and studies that earn authoritative coverage.
For methodology questions, additional data cuts, or research enquiries: contact@ranking-atlas.com.