Welcome to the SaaSpocalypse
Software that can be vibe-coded by a small team has lost all pricing power, while AI-resistant SaaS categories raised entry-tier prices up to three times faster than inflation.
Content Written By:
Daniel Grainger
Founder, Ranking Atlas
Published April 2026
Key Takeaways
- Analytics raised median entry-tier prices by 81.3%, three times the rate of inflation. HR (+66.7%), Marketing (+57.9%), Accounting (+53.3%), and Support (+50.0%) all sit well above the 27.1% US CPI benchmark. These are categories whose core work depends on human process, regulated reporting, or integrations that current AI tooling cannot reliably replicate.
- CRM, Productivity, and Dev tooling all returned median price changes of 0.0%. Project Management came in at +2.0%, well below inflation. Visual Design fell 38.9% on a small sample of two tools. Every category at or below the inflation line is one whose entry-tier function can now be approximated by a small team with AI assistants.
- Kayako, a customer support tool, raised its entry tier from $15 to $79 per agent per month, a 427% increase. Klipfolio (Analytics, +185.7%), JazzHR (HR, +182.1%), Later (Marketing, +177.8%), and Hiver (Support, +150%) round out the top five. Every tool that raised prices more than 150% sits in an AI-resistant category.
- Vtiger CRM cut its entry tier from $42 to $15 per user per month, a 64.3% decline. Venngage (Visual Design, -61.2%), Copper (CRM, -50%), CircleCI (Dev, -50%), and Constant Contact (Marketing, -40%) make up the rest of the top five cuts. Four of the five sit in AI-replicable categories.
- Asana's Premium tier (now Starter) has held at $10.99 per user per month since January 2020. Holding flat against 27.1% CPI is itself a real-terms price cut of roughly 21%. The flat-list-price defence is the most common move in AI-exposed categories.
AI-Resistant Categories Raised Prices Above Inflation
Median percentage change in lowest monthly entry tier by category, sorted by magnitude of change. All categories include at least three tools except Visual Design (n=2), disclosed below. The 27.1% line is US CPI over the same period.
| Category | Tools | Median Change | AI Replicability |
|---|---|---|---|
| Analytics | 4 | +81.3% | Resistant |
| HR | 5 | +66.7% | Resistant |
| Marketing | 11 | +57.9% | Mixed |
| Accounting | 5 | +53.3% | Resistant |
| Support | 5 | +50.0% | Resistant |
| Comms | 3 | +33.3% | Resistant |
| Ecommerce | 8 | +20.4% | Resistant |
| Project Mgmt | 7 | +2.0% | Replicable |
| CRM | 7 | +0.0% | Replicable |
| Productivity | 3 | +0.0% | Replicable |
| Dev | 5 | +0.0% | Replicable |
| Visual Design | 2 | -38.9% | Replicable |
Marketing is classified as "Mixed" because individual tools within the category varied widely in their replaceability exposure: email marketing software and SEO platforms behave differently from social media schedulers.
Kayako Raised Entry-Tier Prices by 427% in Six Years
The five tools with the largest percentage price increases on their lowest monthly entry tier. Every one sits in an AI-resistant category.
| Tool | Category | Jan 2020 | Apr 2026 | Change |
|---|---|---|---|---|
| Kayako | Support | $15.00 | $79.00 | +426.7% |
| Klipfolio | Analytics | $49.00 | $140.00 | +185.7% |
| JazzHR | HR | $39.00 | $110.00 | +182.1% |
| Later | Marketing | $9.00 | $25.00 | +177.8% |
| Hiver | Support | $14.00 | $35.00 | +150.0% |
AI-Replicable Tools Cut Entry-Tier Prices by Up to 64%
The five tools with the largest percentage price declines on their lowest monthly entry tier. Four of the five sit in AI-replicable categories. When a software category loses pricing power, the differentiator shifts from product to perception, and perception in the AI search era is decided by citation equity.
| Tool | Category | Jan 2020 | Apr 2026 | Change |
|---|---|---|---|---|
| Vtiger | CRM | $42.00 | $15.00 | -64.3% |
| Venngage | Visual Design | $49.00 | $19.00 | -61.2% |
| Copper | CRM | $24.00 | $12.00 | -50.0% |
| CircleCI | Dev | $30.00 | $15.00 | -50.0% |
| Constant Contact | Marketing | $20.00 | $12.00 | -40.0% |
Two Pricing Trajectories Verified Against the Wayback Machine
Two examples of Wayback Machine snapshots used to verify 2020 pricing: Kayako, which raised its entry tier 427% in six years, and Asana, which held flat across the same period. Full set of source snapshots available on request.
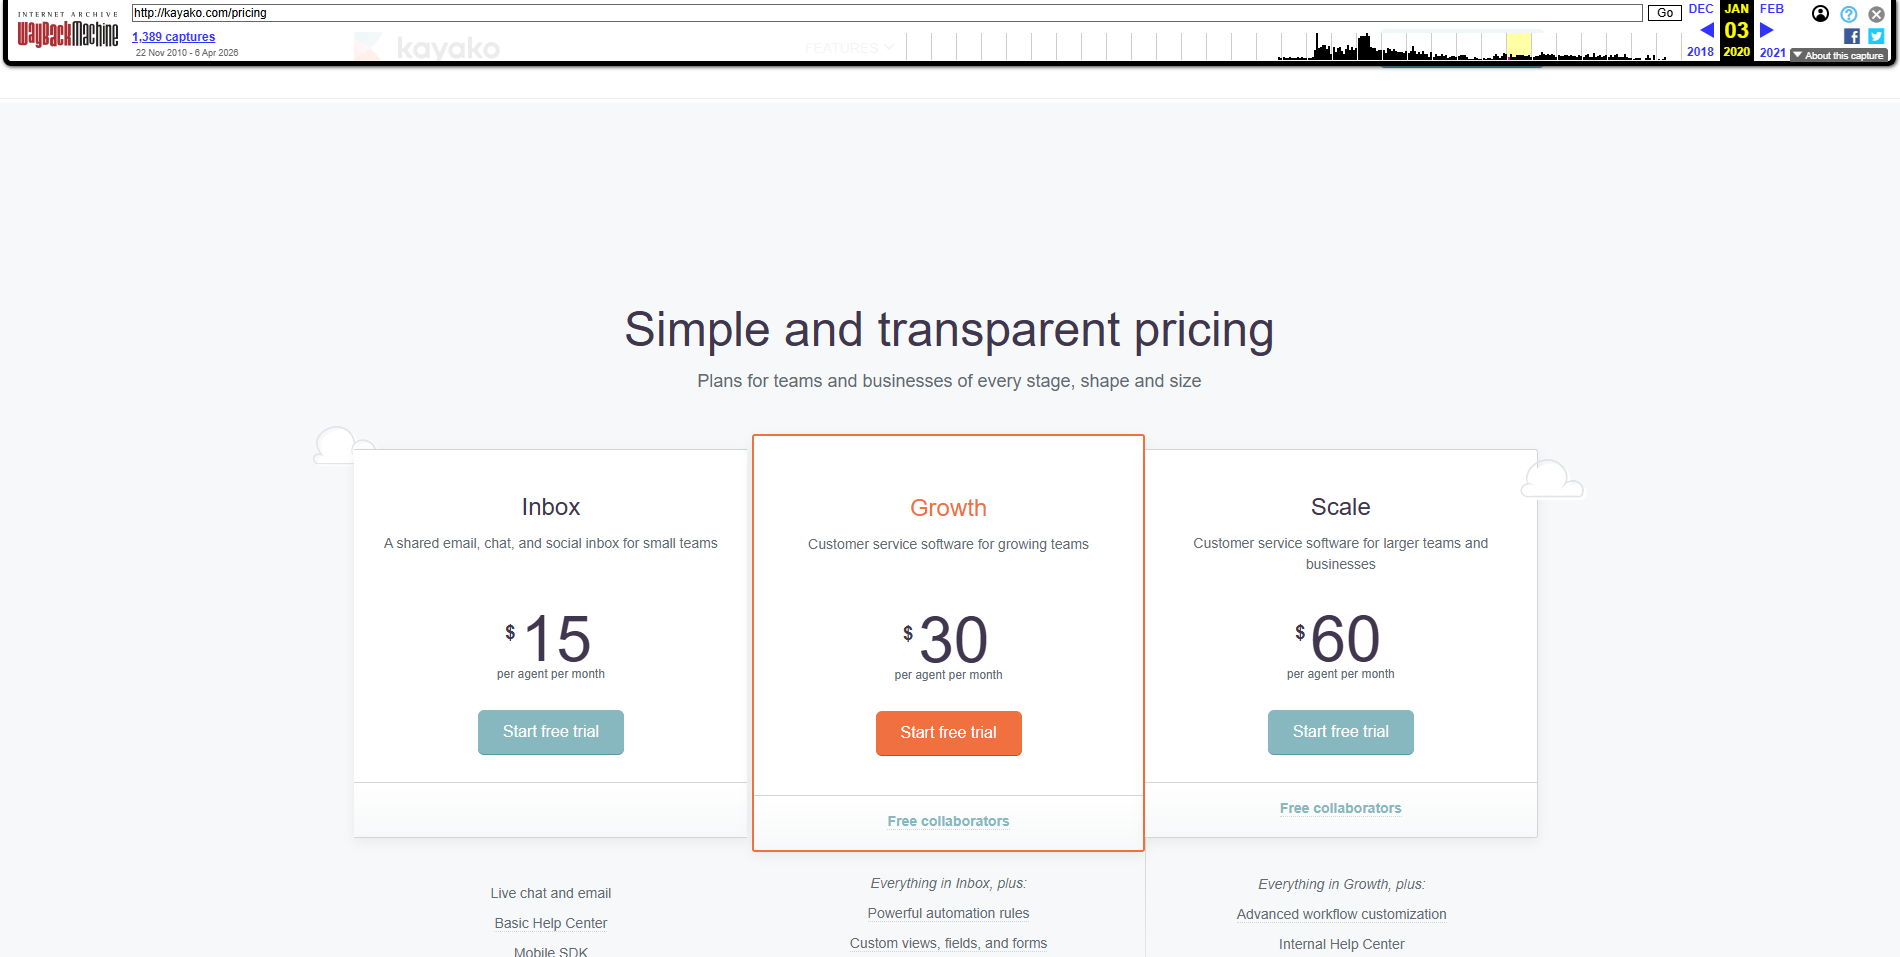
Kayako: entry tier 2020 vs 2026
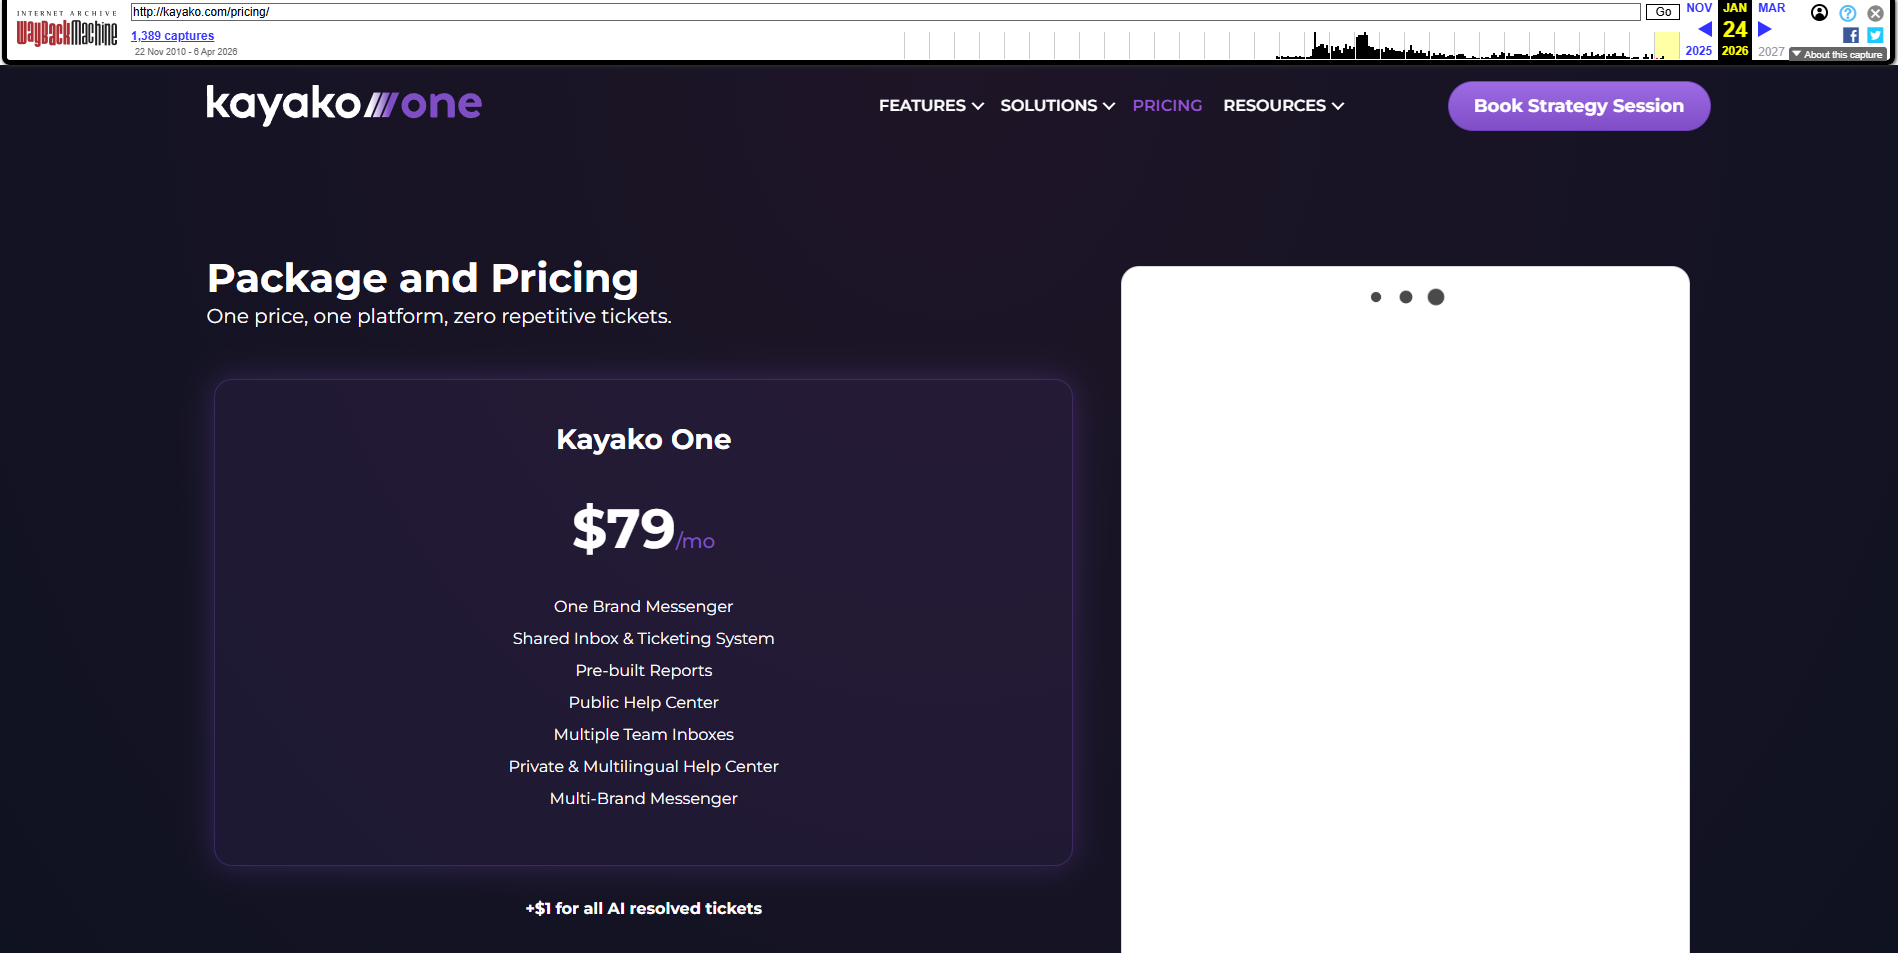
Kayako's lowest paid monthly subscription rose from $15 per agent per month in January 2020 to $79 per agent per month for Kayako One in April 2026, a 427% increase.
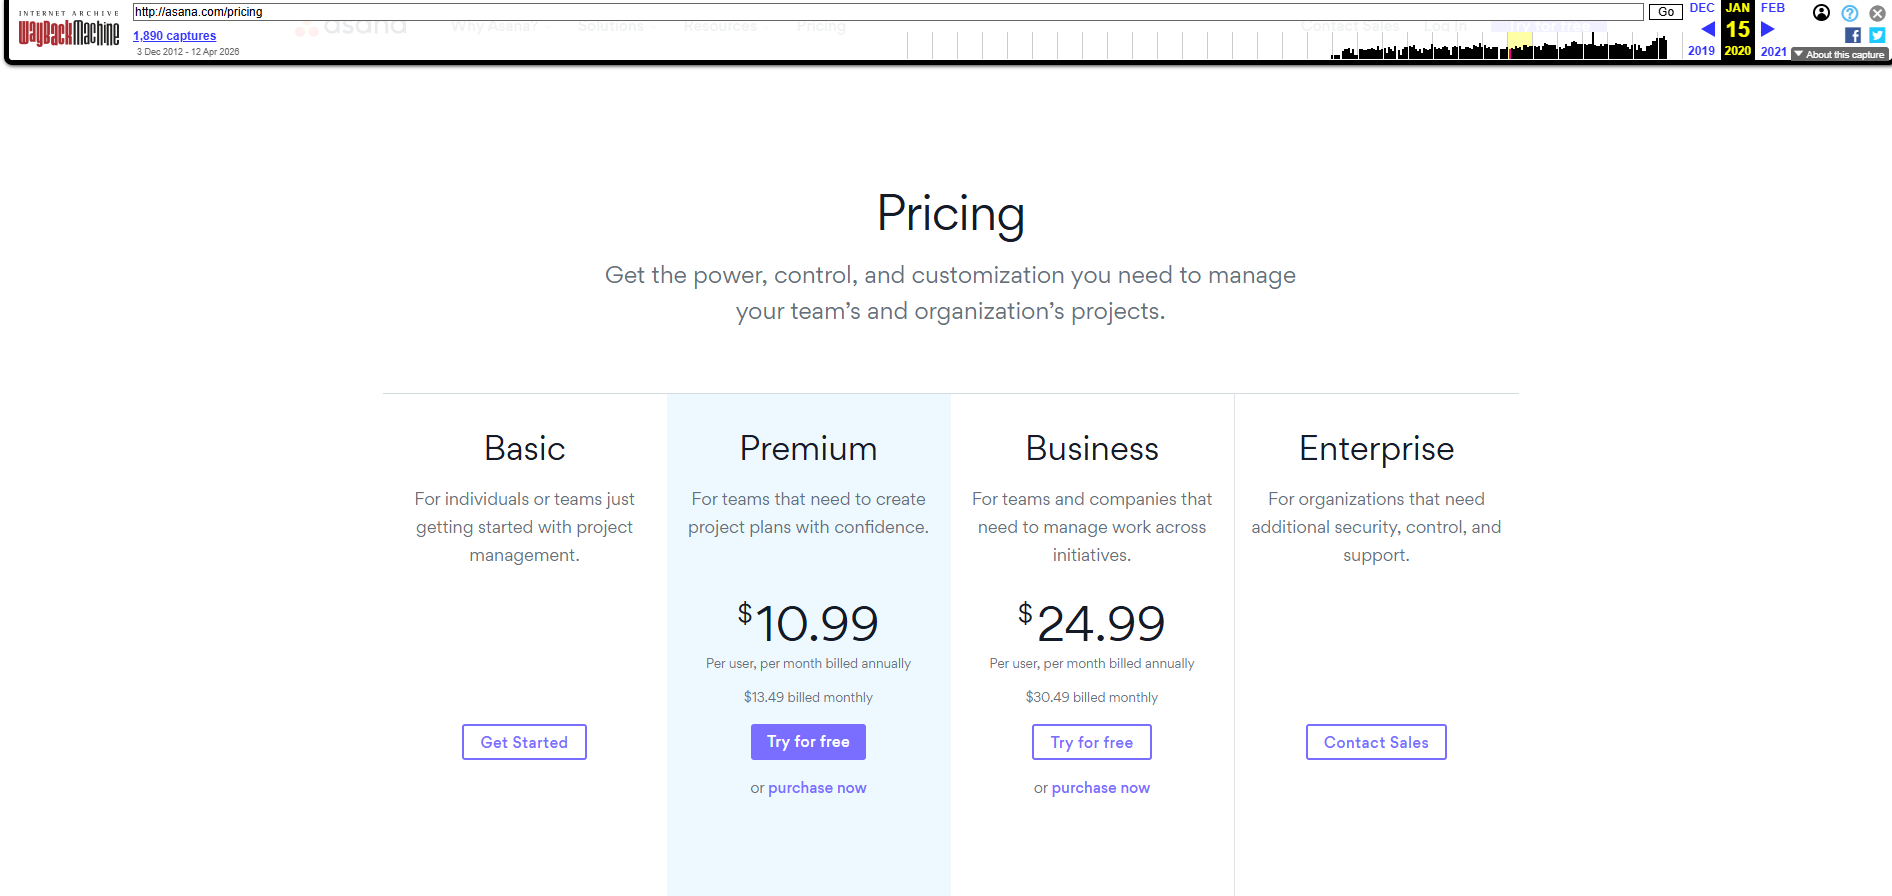
Asana: six years unchanged
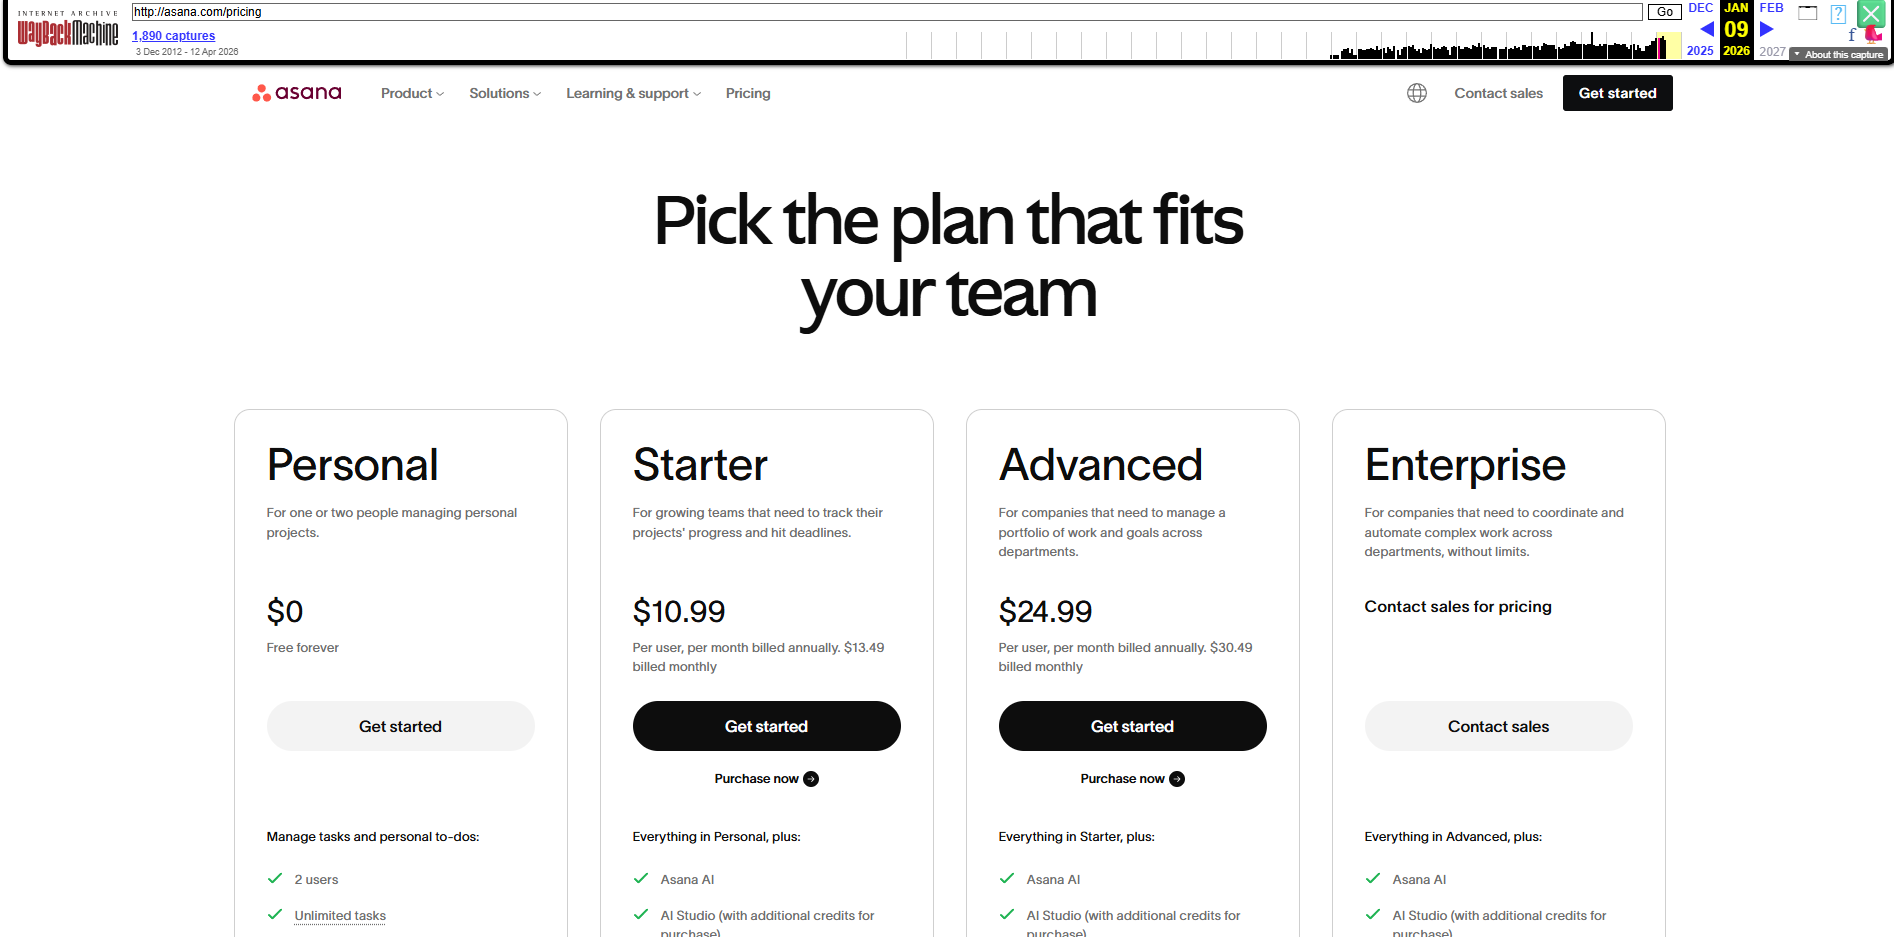
Asana's Premium tier, now Starter, has held at $10.99 per user per month since January 2020. Against 27.1% US CPI, that flat list price is a real-terms cut of roughly 21%.
All 65 Tools Ranked by Price Change
Every tool in the sample, ranked by percentage change. Prices in USD, monthly billing cycle, lowest-priced standalone paid subscription published on the vendor's default pricing page in each year. Changes above +27.1% beat US CPI over the period. Negative values indicate price cuts.
| # | Tool | Category | Jan 2020 | Apr 2026 | Change |
|---|---|---|---|---|---|
| 1 | Kayako | Support | $15.00 | $79.00 | +426.7% |
| 2 | Klipfolio | Analytics | $49.00 | $140.00 | +185.7% |
| 3 | JazzHR | HR | $39.00 | $110.00 | +182.1% |
| 4 | Later | Marketing | $9.00 | $25.00 | +177.8% |
| 5 | Hiver | Support | $14.00 | $35.00 | +150.0% |
| 6 | Xero | Accounting | $11.00 | $25.00 | +127.3% |
| 7 | Zoho Books | Accounting | $9.00 | $20.00 | +122.2% |
| 8 | Deputy | HR | $2.50 | $5.50 | +120.0% |
| 9 | Wishpond | Marketing | $49.00 | $99.00 | +102.0% |
| 10 | Sprout Social | Marketing | $99.00 | $199.00 | +101.0% |
| 11 | Airtable | Project Mgmt | $10.00 | $20.00 | +100.0% |
| 12 | MailerLite | Marketing | $10.00 | $20.00 | +100.0% |
| 13 | Geckoboard | Analytics | $31.00 | $60.00 | +93.5% |
| 14 | ClickUp | Project Mgmt | $4.00 | $7.00 | +75.0% |
| 15 | Todoist | Project Mgmt | $4.00 | $7.00 | +75.0% |
| 16 | Hotjar | Analytics | $29.00 | $49.00 | +69.0% |
| 17 | When I Work | HR | $1.50 | $2.50 | +66.7% |
| 18 | Weebly | Ecommerce | $6.00 | $10.00 | +66.7% |
| 19 | Twist | Comms | $5.00 | $8.00 | +60.0% |
| 20 | Benchmark Email | Marketing | $11.89 | $19.00 | +59.8% |
| 21 | AWeber | Marketing | $19.00 | $30.00 | +57.9% |
| 22 | FreshBooks | Accounting | $15.00 | $23.00 | +53.3% |
| 23 | QuickBooks | Accounting | $25.00 | $38.00 | +52.0% |
| 24 | Pipedrive | CRM | $12.50 | $19.00 | +52.0% |
| 25 | Help Scout | Support | $20.00 | $30.00 | +50.0% |
| 26 | Webflow | Ecommerce | $12.00 | $18.00 | +50.0% |
| 27 | Re:amaze | Support | $20.00 | $29.00 | +45.0% |
| 28 | Chanty | Comms | $3.00 | $4.00 | +33.3% |
| 29 | Shopify | Ecommerce | $19.00 | $25.00 | +31.6% |
| 30 | Ahrefs | Marketing | $99.00 | $129.00 | +30.3% |
| 31 | Crazy Egg | Analytics | $24.00 | $29.00 | +20.8% |
| 32 | Volusion | Ecommerce | $29.00 | $35.00 | +20.7% |
| 33 | Kajabi | Ecommerce | $149.00 | $179.00 | +20.1% |
| 34 | SurveyMonkey | Productivity | $25.00 | $30.00 | +20.0% |
| 35 | Nimble | CRM | $25.00 | $29.90 | +19.6% |
| 36 | LiveChat | Support | $16.00 | $19.00 | +18.8% |
| 37 | Sentry | Dev | $26.00 | $29.00 | +11.5% |
| 38 | Breezy HR | HR | $171.00 | $189.00 | +10.5% |
| 39 | Mailjet | Marketing | $8.69 | $9.00 | +3.6% |
| 40 | Wrike | Project Mgmt | $9.80 | $10.00 | +2.0% |
| 41 | RingCentral | Comms | $29.99 | $30.00 | +0.0% |
| 42 | Sellfy | Ecommerce | $29.00 | $29.00 | +0.0% |
| 43 | Insightly | CRM | $29.00 | $29.00 | +0.0% |
| 44 | Asana | Project Mgmt | $10.99 | $10.99 | +0.0% |
| 45 | Datadog | Dev | $15.00 | $15.00 | +0.0% |
| 46 | Grammarly | Productivity | $12.00 | $12.00 | +0.0% |
| 47 | Agile CRM | CRM | $8.99 | $8.99 | +0.0% |
| 48 | Loggly | Dev | $79.00 | $79.00 | +0.0% |
| 49 | Vercel | Dev | $20.00 | $20.00 | +0.0% |
| 50 | Otter.ai | Productivity | $8.33 | $8.33 | +0.0% |
| 51 | Teachable | Ecommerce | $39.00 | $39.00 | +0.0% |
| 52 | Moz | Marketing | $99.00 | $99.00 | +0.0% |
| 53 | Gusto | HR | $51.00 | $49.00 | -3.9% |
| 54 | Harvest | Accounting | $12.00 | $11.00 | -8.3% |
| 55 | Smartsheet | Project Mgmt | $14.00 | $12.00 | -14.3% |
| 56 | Framer | Visual Design | $12.00 | $10.00 | -16.7% |
| 57 | Drip | Marketing | $49.00 | $39.00 | -20.4% |
| 58 | BigCommerce | Ecommerce | $39.00 | $29.95 | -23.2% |
| 59 | Nutshell | CRM | $22.00 | $15.00 | -31.8% |
| 60 | Paymo | Project Mgmt | $9.56 | $5.90 | -38.3% |
| 61 | Constant Contact | Marketing | $20.00 | $12.00 | -40.0% |
| 62 | CircleCI | Dev | $30.00 | $15.00 | -50.0% |
| 63 | Copper | CRM | $24.00 | $12.00 | -50.0% |
| 64 | Venngage | Visual Design | $49.00 | $19.00 | -61.2% |
| 65 | Vtiger | CRM | $42.00 | $15.00 | -64.3% |
Methodology
The dataset tracks the lowest-priced monthly subscription published on each vendor's default pricing page in January 2020 and April 2026. 2020 prices were taken from the closest available Wayback Machine snapshot to January 2020. 2026 prices were taken from live vendor pricing pages captured in April 2026.
Inclusion rules: a tool was included only if it published a monthly-billed entry-tier price on its default pricing page in both years, and if its pricing model remained directly comparable between the two dates. Tools that moved from seat-based to consumption-based pricing (or vice versa) were excluded as non-comparable. Tools where the 2020 Wayback snapshot was incomplete, missing, or ambiguous were excluded.
Price selection: the lowest-priced paid standalone subscription, on monthly billing (not annual-billed-monthly-equivalent), exact figure as published. Free tiers, trials, usage add-ons, SMS and AI credit packs, and per-user fees beyond the base plan were excluded. Where a vendor showed both monthly and annual billing, the monthly figure was taken in both years. Annual discounts have widened at many vendors during the period, which would obscure underlying price movement.
Category assignment: each tool was assigned to a single category based on its primary product function in 2026. Categories with fewer than three tools were excluded, with one exception: Visual Design (n=2, Framer and Venngage) was retained as a standalone category because both tools directly represent the creative design software segment most exposed to generative AI substitution.
AI-replicability classification: categories were labelled as "Replicable" or "Resistant" based on whether the core product function could reasonably be approximated by a small team using 2026 AI coding assistants and generative AI tools. This is a judgement label, not a measurement. Marketing is labelled "Mixed" because the category contains tools with materially different replaceability profiles.
Inflation comparison: US Consumer Price Index (all urban consumers) rose 27.1% between January 2020 and March 2026, per Bureau of Labor Statistics data.
Limitations
List price is not always the price paid. Enterprise discounting, partner pricing, and promotional credits sit outside this dataset and can shift effective realised price in ways the published pricing page does not show. The list-price comparison is the cleanest like-for-like read available without privileged access to vendor billing data.
The AI-replicability label is a judgement, not a measurement. Where a category sits on the replicable-to-resistant spectrum will continue to shift as AI capability advances. Today's resistant category can become tomorrow's replicable one. The current classification reflects an informed view of 2026 capability, not a settled framework.
Pricing-page design itself changed across the window. Several vendors moved from clear three- or four-column pricing pages to "contact sales" gating, particularly at higher tiers. The dataset only includes tools whose entry tier remained publicly listed in both 2020 and 2026, which biases inclusion toward smaller and mid-market vendors and away from vendors that retreated into private quoting.
Sample size by category varies. Categories with three or four tools (Comms, Productivity, Analytics) carry more single-point sensitivity than categories with seven or eight (Project Mgmt, Ecommerce, Marketing). The directional finding (AI-replicable categories cluster at or below zero, AI-resistant categories cluster well above CPI) is robust to small-sample noise at the category level.
The 65-tool sample is a sample, not a census. Coverage skews toward SMB and mid-market SaaS with publicly listed pricing. Enterprise SaaS, infrastructure platforms, and vertical-specific tools are under-represented. Conclusions describe the publicly priced mid-market layer of SaaS, not the full software economy.
For a different cut of this dataset, additional category or vendor breakouts, or methodology questions, contact contact@ranking-atlas.com.
Related Research
The Hidden Economy Behind Google Rankings
This data report analyses 140,000 publisher listings to show how paid link markets expanded after repeated Google crackdowns.
One Woman for Every Ten: How AI Names the Experts in Tech
2,286 named individuals from 2,520 AI responses across ChatGPT, Claude, Gemini, and Perplexity. Women made up 20.5% of named ICT experts against a 28% workforce baseline.
How Brands Get Cited By AI: The 2026 Guide To Citation Equity
This guide explains how AI answer engines choose which brands to cite, and what produces the editorial pattern that puts you in the answer.
Ranking Atlas is a specialist data campaigns firm. We turn proprietary data, commissioned research, and original analysis into visual stories and interactive studies that earn authoritative coverage.
For methodology questions, additional data cuts, or research enquiries: contact@ranking-atlas.com.